What is a “yield curve inversion,” and is it really a good predictor of a recession?
With the Federal Reserve again in the spotlight, investors are focused on the potential for further rate hikes, the yield curve, and whether a recession may likely be coming. In our last commentary, we explained the reasons why we do not believe that we are currently in a recession. However, a recession is certainly still possible. The main fear amongst investors is that the Federal Reserve’s continued rate hikes of potentially 0.75% or more may dampen economic activity TOO much, which may inevitably cause a recession.
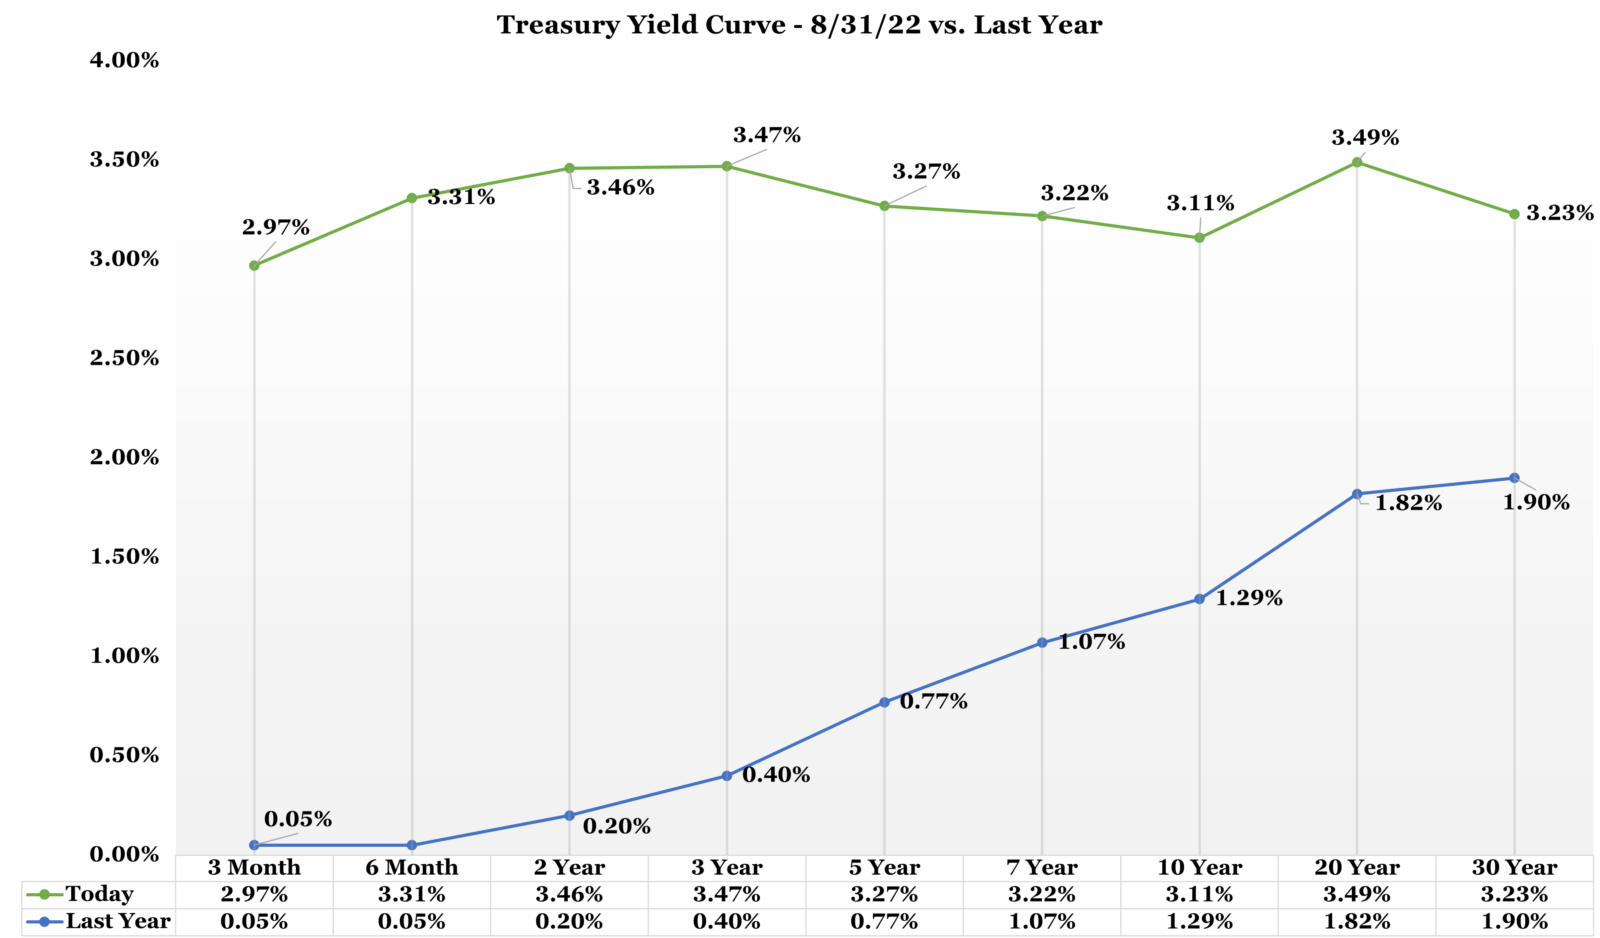
Related to the Fed’s actions is what the yield curve1 may be telling us. When economic activity is solid and showing growth, the yield curve usually “steep,” meaning long-term bond rates are higher than their shorter-term counterparts. When economic activity is slowing down and showing weakness, the yield curve tends to be “flat,” meaning interest rates are generally the same or similar across bonds of all maturities.
When growth is negative and a recession is possible, the yield curve has historically “inverted,” meaning that short-term rates move higher than long-term rates. More specifically, investors and economists pay most attention to the spread between the 2-Year Treasury and the 10-Year Treasury when it comes to inversions. As shown in the following chart of the yield curve as of 8/31, the 10-2 year spread is currently inverted. It has also been that way consistently since early July.
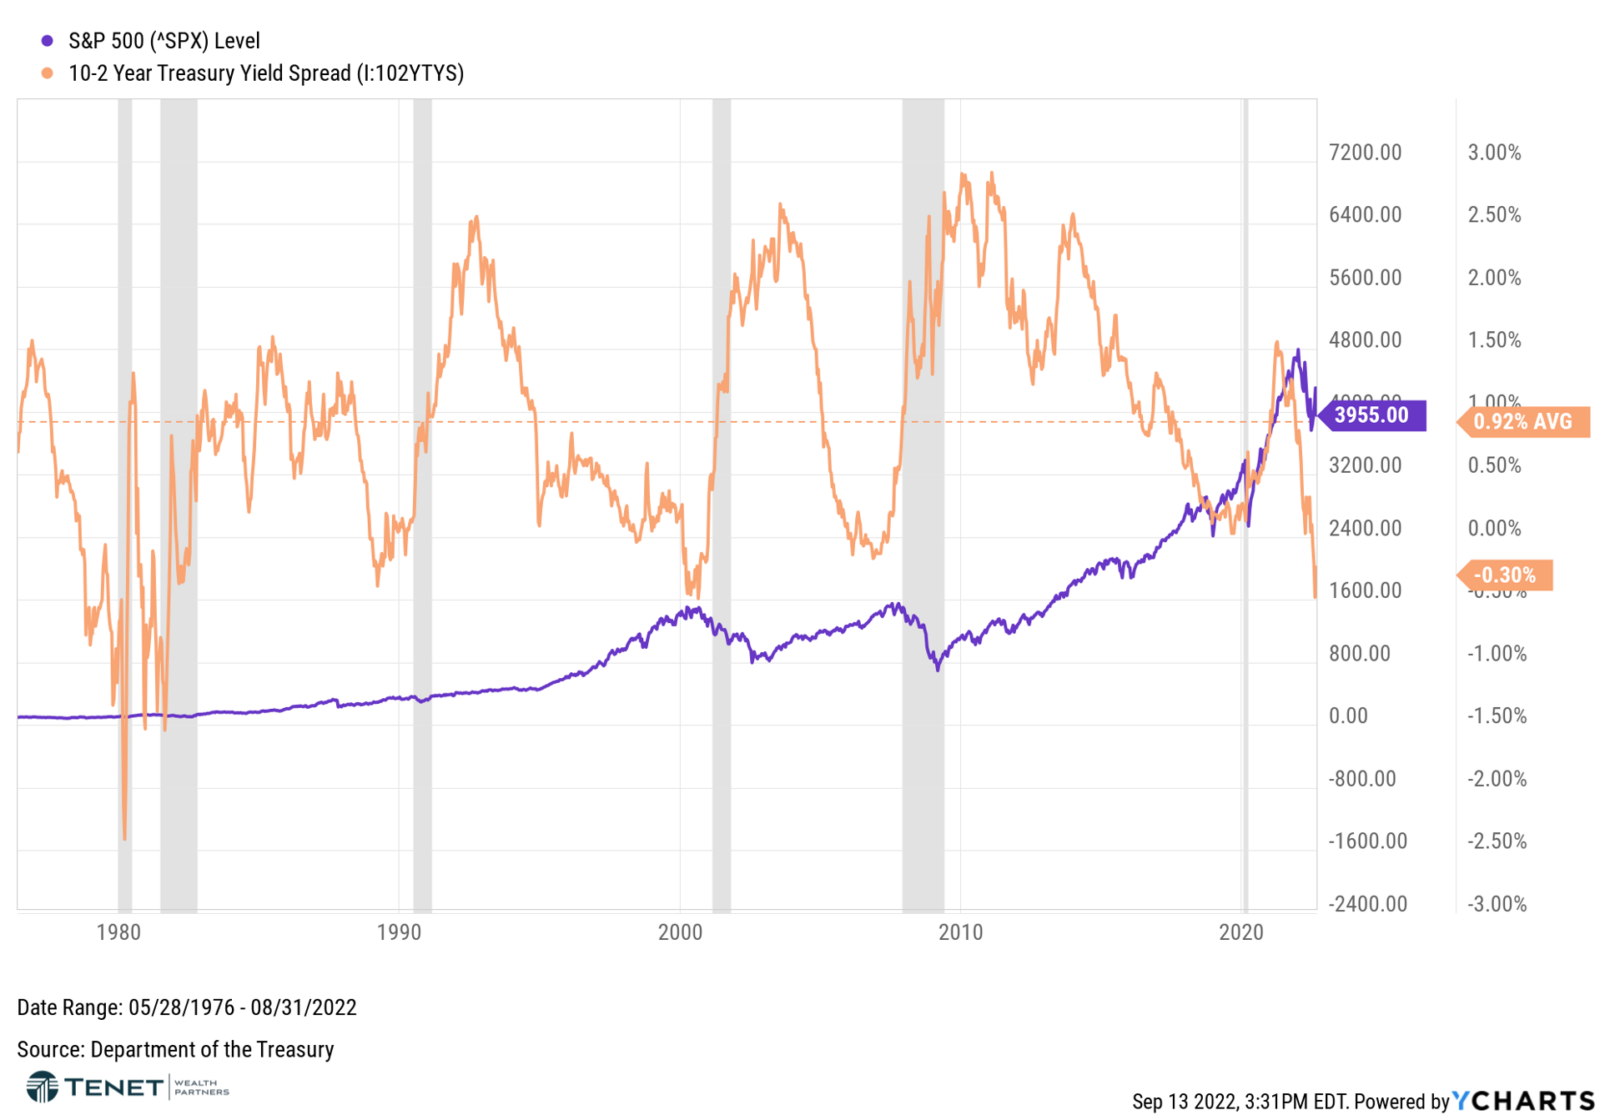
But what does the historical data tell us with regards to these inversions being a predictor of market declines and recessions? The first chart shows the 10-2 year spread compared with S&P 500 performance since 1976, and the gray bars indicate a recession. There have been 6 recessions over that timeframe, and 7 inversions of the 10-2 year spread (including a very short 3-day inversion in 2019).
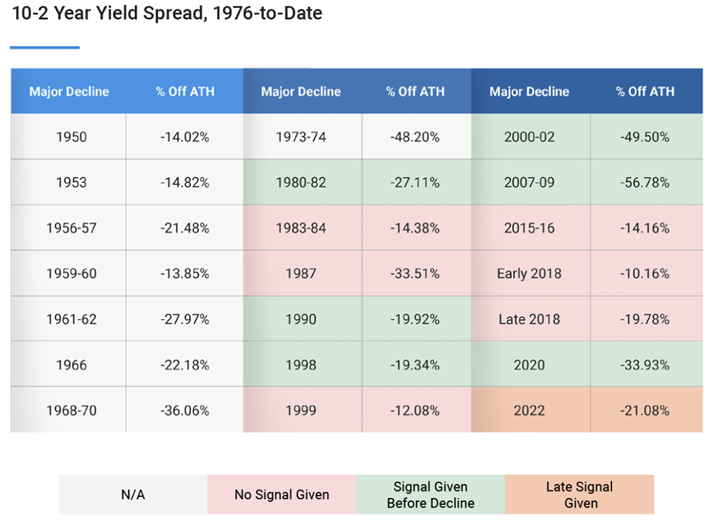
Next, let’s take a look back at major declines since 1976 and see in which cases a warning signal (inversion of the 10-2 year spread) was given. The boxes highlighted in green show that a signal was given before the decline, the orange boxes show a late signal was given, and the pink boxes indicate that no signal was given. Out of the 13 possible major market declines shown in the chart, the 10-2 year spread inverted and gave an early warning of a recession in 6 of them, which equates to a 46% rate of accuracy.
Source: YCharts
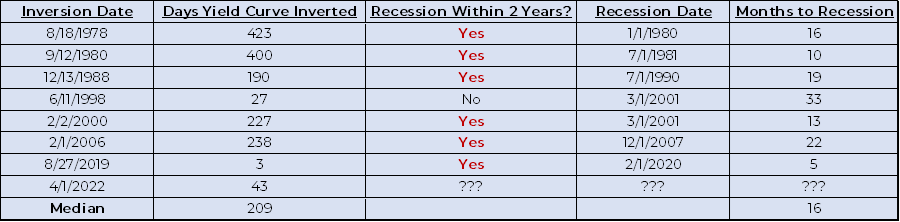
Now let’s take a closer look at inversions as recession indicators specifically. For the 6 instances where a recession occurred, how many days was the yield curve inverted? And, how many months until a recession occurred? It certainly varied based on the period, but the median number of days where the yield curve was inverted was 209, while the median months to recession was 16. Thus far in 2022, the yield curve has been inverted for 43 days, so based on the median data shown (and assuming inversions are good predictors of recessions), a recession technically wouldn’t be expected for another 5-14 months.
Source: YCharts, Bloomberg, Putnam, Wall Street Journal, CNBC
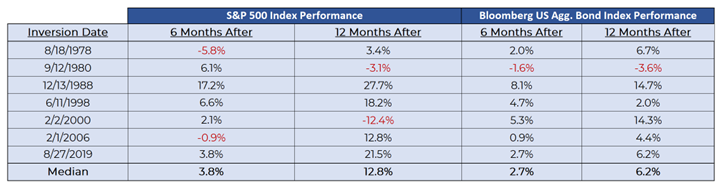
Even if this latest inversion successfully predicts a recession, it’s important to note that the historical market performance following inversions has been mostly positive. As shown in the below chart, the median return for the S&P 500 was 3.8% in the six months after the inversion and 12.8% one year after the inversion. On the fixed income side, bonds have also performed well with the Bloomberg U.S. Aggregate Bond Index posting a median return of 2.7% in the six months after inversion and then 6.2% one year after inversion.
Source: YCharts, Bloomberg, Putnam, Wall Street Journal, CNBC
So are inversions good predictors of recessions? Possibly, but there are so many other factors to consider when making such projections. As we stated in last month’s commentary, the current state of the economy is much different (and more positive) compared with these other past recessions. Given this, it is hard to state with firm conviction that this latest inversion means a recession is coming, and all data (not just the inversion itself) needs to be considered.
As an investor, this year’s inversion (along with Fed actions, high inflation, and geopolitical issues) may cause further, prolonged volatility (both upward and downward). A recession could also occur as well, leading to potentially negative returns. However, over the long haul, the market has tended to rebound, rewarding those investors who stick to their target strategy. As always, and no matter what, stay patient, remain vigilant, be diversified in your portfolio, and keep focused on your long-term wishes. Reach out to our team with any questions!
1 Graphical line/chart showing interest rates of Treasury bonds ranging from 3 months to 30 years
Sources: YCharts, Bloomberg, CNBC, Wall Street Journal, Putnam
Registered Representative of Sanctuary Securities Inc. and Investment Advisor Representative of Sanctuary Advisors, LLC. Securities offered through Sanctuary Securities, Inc., Member FINRA, SIPC. Advisory services offered through Sanctuary Advisors, LLC., a SEC Registered Investment Advisor. Tenet Wealth Partners is a DBA of Sanctuary Securities, Inc. and Sanctuary Advisors, LLC.
The information provided in this communication was sourced by Tenet Wealth Partners through public information and public channels and is in no way proprietary to Tenet Wealth Partners, nor is the information provided Tenet Wealth Partner’s position, recommendation or investment advice. This material is provided for informational/educational purposes only. This material is not intended to constitute legal, tax, investment or financial advice. Investments are subject to risk, including but not limited to market and interest rate fluctuations. Any performance data represents past performance which is no guarantee of future results. Prices/yields/figures mentioned herein are as of the date noted unless indicated otherwise. All figures subject to market fluctuation and change. Additional information available upon request. The “Sample Diversified Portfolio (60/40 Allocation) is comprised of the following total return indices and allocations: 40% S&P 500, 3% S&P 400, 4% S&P 600, 15% MSCI EAFE, 5% MSCI Emerging Markets, 40% Bloomberg US Aggregate Bond.