June 2023’s Investment Commentary sheds light on the current market situation with an overview of major index returns, stock valuations, and economic indicators. Stay informed about the current market landscape with this comprehensive analysis.
Major Index Returns – QTD & YTD 2023
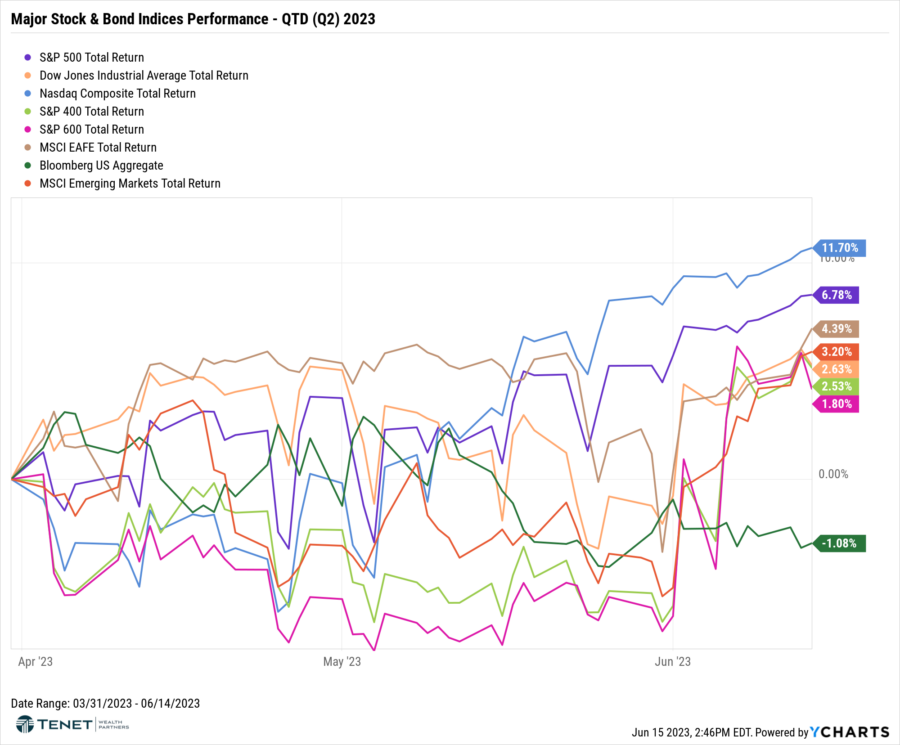
Stocks have continued to march higher over the last few months, and now all major stock indices are positive for Q2. Quarter-to-date, Technology stocks (represented by the NASDAQ) are up over 11% with the S&P 500 up over 6.5%, both continuing to surpass their developed international equity (EAFE) which are up over 4%. U.S. Small Cap and Mid Cap stocks (S&P 600 and S&P 400) have continued to lag with returns below 3% for both asset classes.
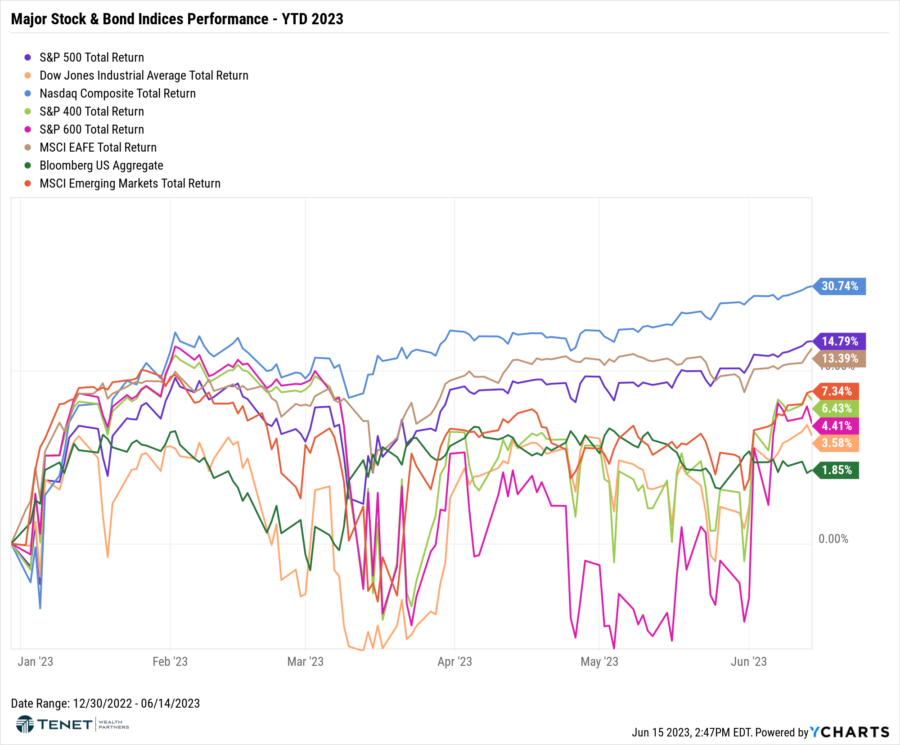
Year-to-date, all major equity indices, as well as aggregate bonds (Bloomberg US Aggregate), are positive for the year. The NASDAQ Composite Index has continued its dominance with returns now surpassing 30% for the year. The largest six names of the index have accounted for virtually all the index’s return this year (i.e., Apple, Microsoft, Tesla, NVIDIA, Amazon). YTD returns for all six stocks are up over 40% overall, led by NVIDIA and Tesla which are up over 100%. In other words, performance of US stocks has been very top-heavy.
Beyond Technology stocks, the S&P 500 and developed international equity (EAFE) are both reporting strong results, up over 14% and 13%, respectively. Emerging Market stocks and US Mid Cap stocks (S&P 400) have also shown robust returns of over 7% and over 6%, respectively.
US Stock Valuations By Sector
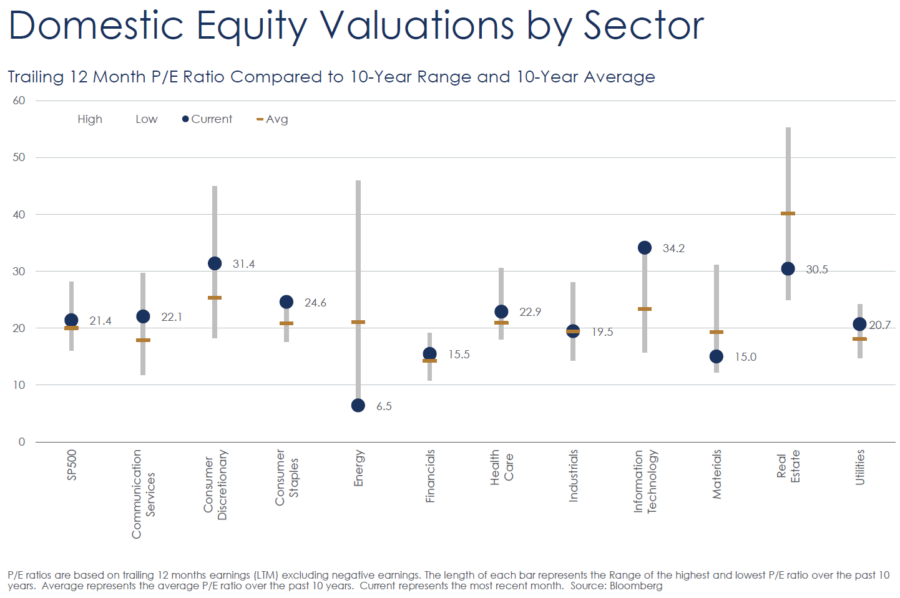
With equity prices rising over the last several months while earnings have declined, valuations of most stock sectors are now elevated compared with 10-year averages. At this stage, the only sectors that are either fairly valued or discounted are Energy, Industrials, Materials, and Real Estate. It is also important to point out that the most overvalued sectors, namely Information Technology, Consumer Discretionary, and Communications, make up a combined 47% of the total S&P 500 index.
S&P 500 Corporate Earnings & Valuation
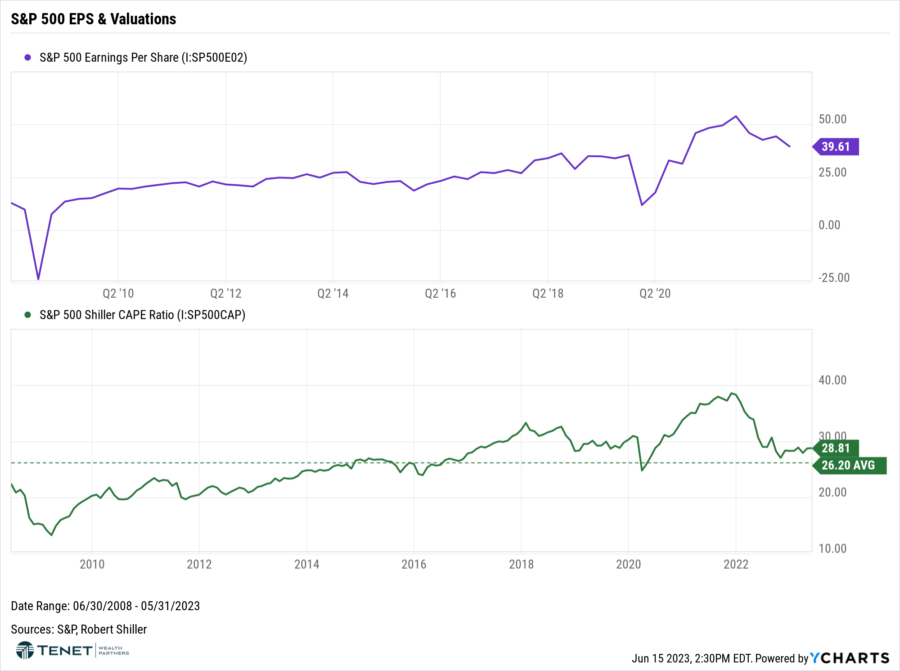
According to FactSet, the projected Q2 earnings decline for the S&P 500 is -6.4%, which would mark the largest earnings decline in the last three years. Additionally, 66 S&P 500 companies have issued negative guidance for Q2 compared with 44 companies issuing positive guidance. While earnings have been declining, overall results have been more of a mixed bag as opposed to a broader, consistent drop. With stock prices rising, we have also begun to see the Shiller CAPE (Cyclically-Adjusted Price-to-Earnings) ratio rise above the historical 15-year average, which indicates that stocks have become more expensive and are broadly overvalued.
Bond Yields & Performance
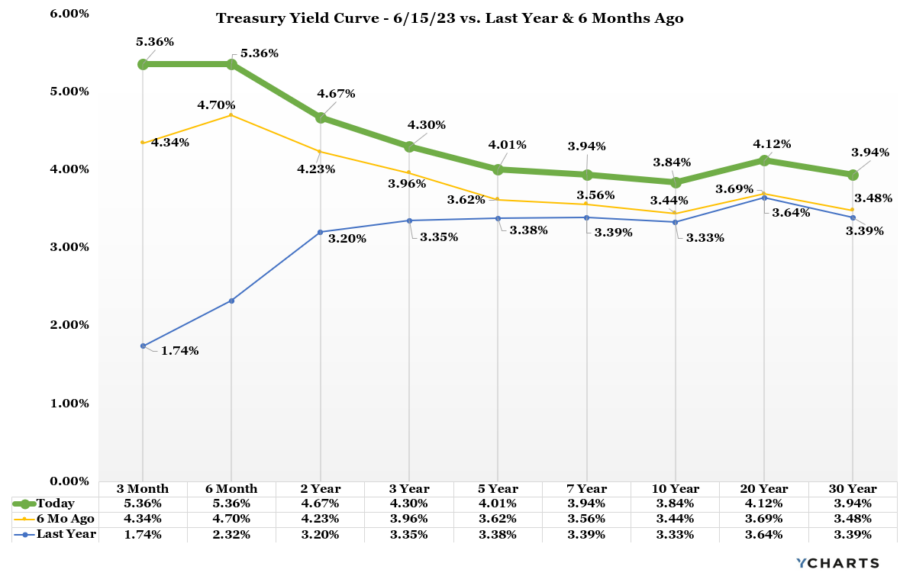
Treasury yields rose in May and continue to rise thus far in June, particularly on the short-intermediate end of the curve. Even though the Fed decided to pause rate hikes at their June meeting, this jump in yields now reflects a higher likelihood that the Fed raises interest rates 1-2 more times before year-end as indicated. Chair Powell continues to point to the stubbornness of Core PCE inflation that has not moved down enough for the Fed to step aside longer-term. Riskier bonds outperformed higher-quality bonds, benefiting from improving consumer sentiment and optimism around debt ceiling negotiations. Despite recent resilience of riskier asset prices, slowing growth and restrictive Fed policy create the potential for market volatility ahead and warrant diversifying portfolios with high-quality bonds. Bond investors can capture meaningful income from reasonably priced high-quality bonds.
Economic Growth
Contributions to Percent Change in Real GDP
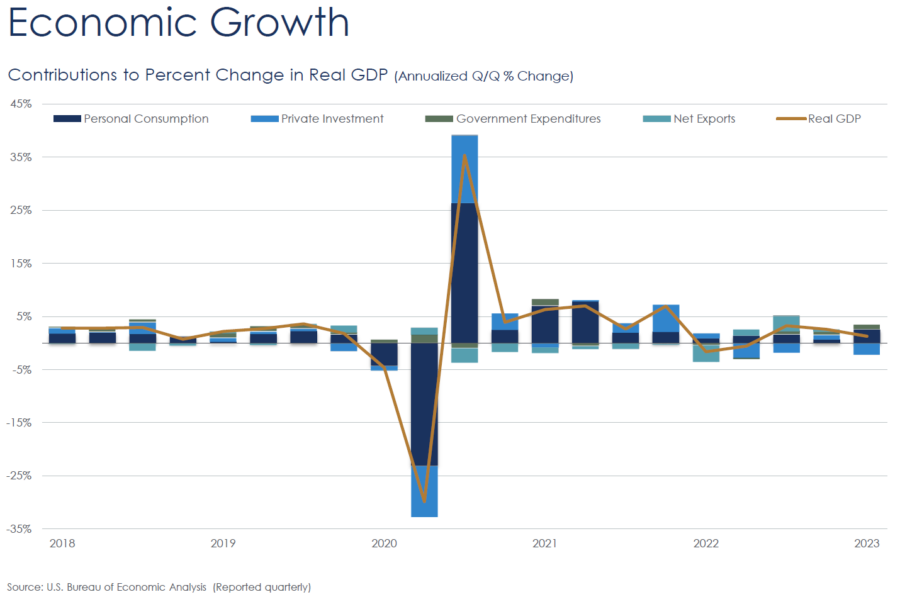
According to the Commerce Department, the U.S. economy grew at a lackluster 1.3% annual rate from January through March as businesses wary of an economic slowdown trimmed their inventories. Despite the first-quarter slowdown, consumer spending, which accounts for around 70% of America’s economic output, rose at a 3.8% annual pace, the most in nearly two years and an encouraging sign of household confidence. Consumers are still spending, tapping into savings and credit to be able to do so. However, it is unlikely for this to persist indefinitely, raising the risk of a slowdown or mild recession the longer the Fed’s battle with inflation drags on.
Inflation Outlook
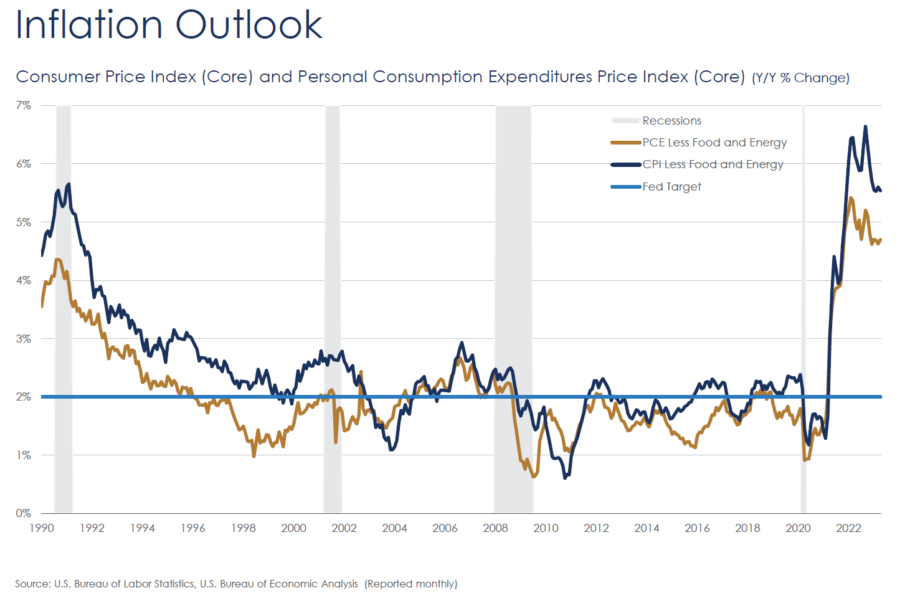
While consumer prices rose again in April, inflation cooled in May. The CPI rose just 0.1% for the month, bringing down the annual rate to its lowest level in two years (4%, down from 4.9% in April). While inflation continues to drop steadily overall, there are signs that further declines in inflation are likely to be slow and bumpy. The Federal Reserve has been closely watching Core inflation (excludes volatile energy and food costs), which rose 0.4% in May and is still up 5.3% from last year. These figures likely put the Fed on track to keep rates higher for longer.
Consumer Health & Outlook
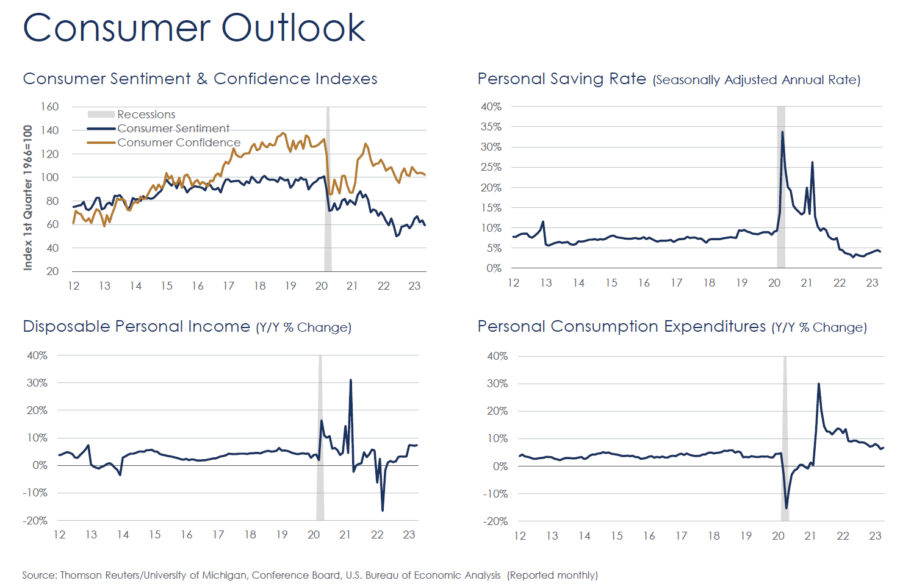
Per the Conference Board, consumers’ view of current conditions became somewhat less upbeat while their expectations remained gloomy. Their assessment of current employment conditions saw the most significant deterioration, with the proportion of consumers reporting jobs are “plentiful” falling to 43.5%. Consumers also became more downbeat about future business conditions. However, expectations for jobs and incomes over the next six months held steady.
Housing Market Outlook
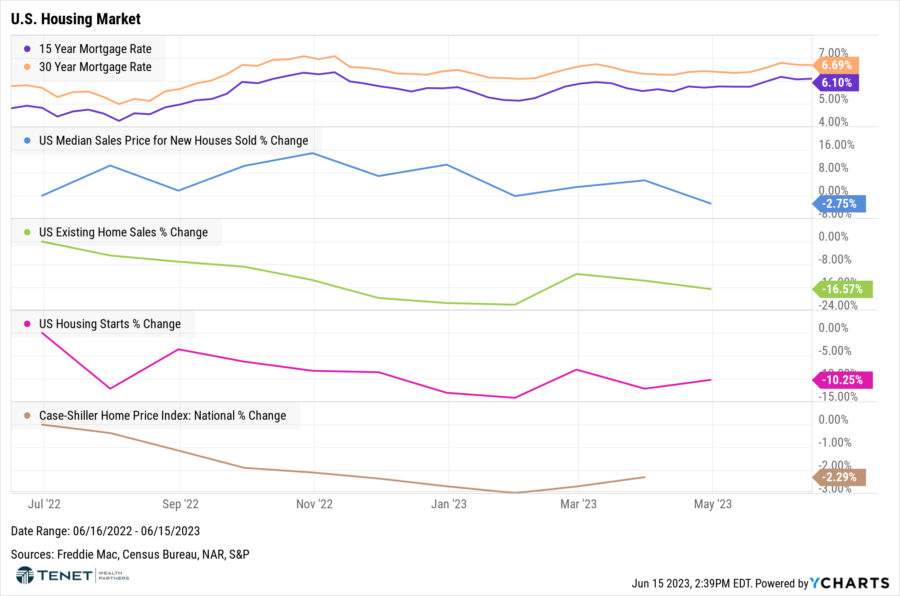
According to the Redfin, pending home sales fell 17% from a year in May. This year-over-year drop is especially notable because pending sales had already started falling at this time last year as mortgage rates shot up past 5%. Seasonally adjusted measures of home buying demand show that it has also dipped in earlier stages of the house hunting journey. Mortgage-purchase applications and Redfin’s Homebuyer Demand Index–a measure of home tours and other service requests from Redfin agents–are both down about 7% from a month ago. On the flip side, we have begun to see signs of home prices and new construction (housing starts) begin to increase over the last few months as demand has picked up with inventory becoming scarcer.
Job Market Outlook
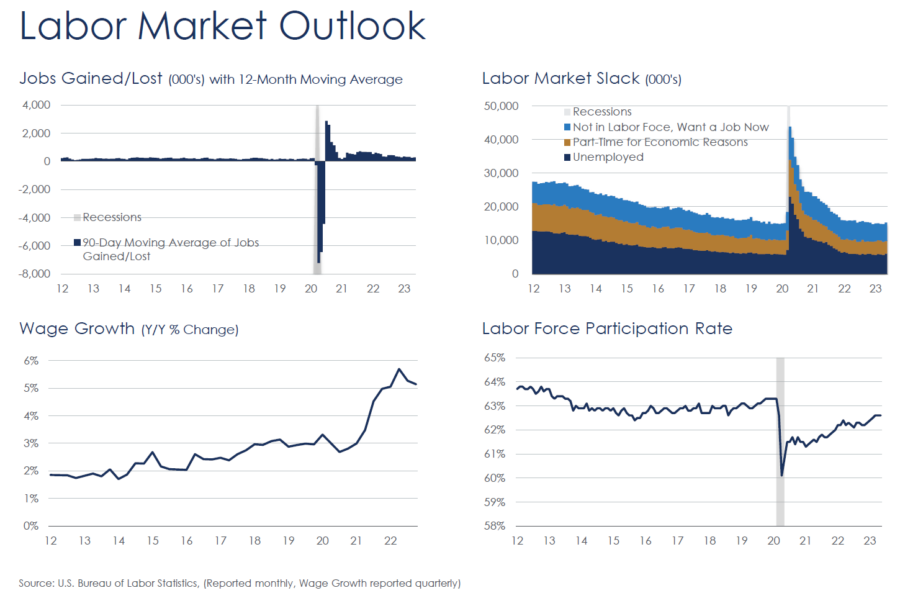
High interest rates, a recent banking crisis and Washington’s fight over the debt ceiling may have shaken the U.S. economy recently, but the U.S. jobs market continues to show signs of strength. The U.S. Bureau of Labor Statistics (BLS) reported 339,000 jobs were added in May, surpassing forecasts that predicted the increase would be approximately 190,000 jobs and a sign of continued growth from the jobs market despite the Federal Reserve’s continuing efforts to cool the economy.
The information provided in this communication was sourced by Tenet Wealth Partners through public information and public channels and is in no way proprietary to Tenet Wealth Partners, nor is the information provided Tenet Wealth Partner’s position, recommendation or investment advice. This material is provided for informational/educational purposes only. This material is not intended to constitute legal, tax, investment or financial advice. Registered Representatives of Sanctuary Securities Inc. and Investment Advisor Representatives of Sanctuary Advisors, LLC. Securities offered through Sanctuary Securities, Inc., Member FINRA, SIPC. Advisory services offered through Sanctuary Advisors, LLC., an SEC Registered Investment Advisor. Tenet Wealth Partners is a DBA of Sanctuary Securities, Inc. and Sanctuary Advisors, LLC.


