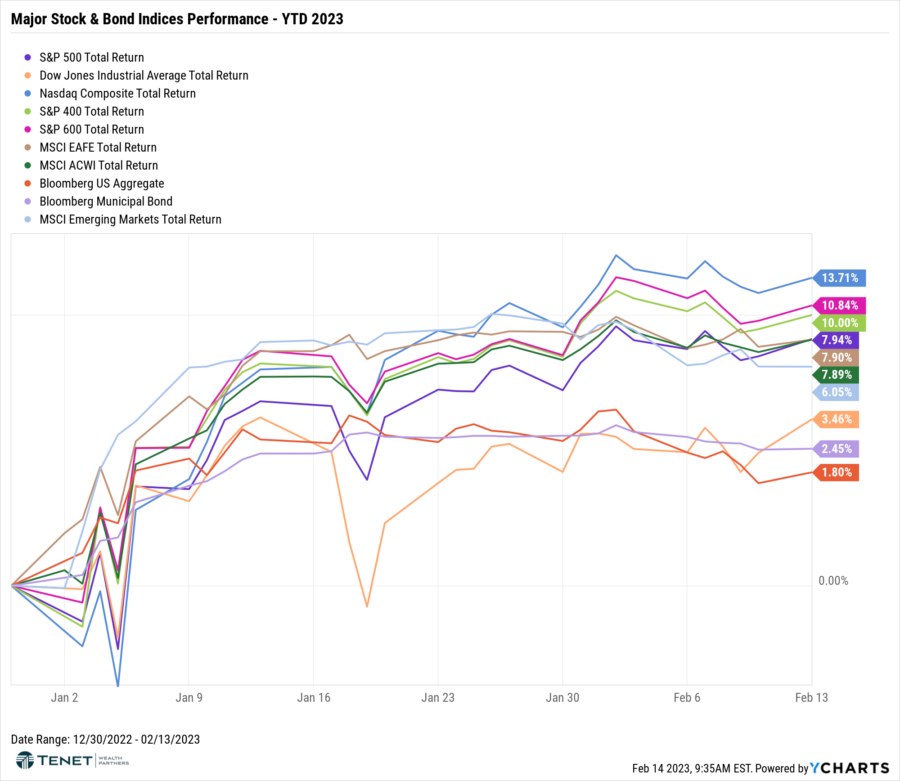
All major stock and bond indexes positive thus far, driven by optimism of falling inflation and a slowdown of future Federal Reserve Rate hikes. The economy has also shown resilience with stronger jobs data and continued consumer (and corporate) resiliency.
In a reversal from 2022, Growth stocks (mainly Technology sector stocks as represented by the NASDAQ) have performed well so far this year, up nearly 14%. Small and Mid Cap stocks have been the next best performers thus far with returns or ~11% and 10%, respectively.
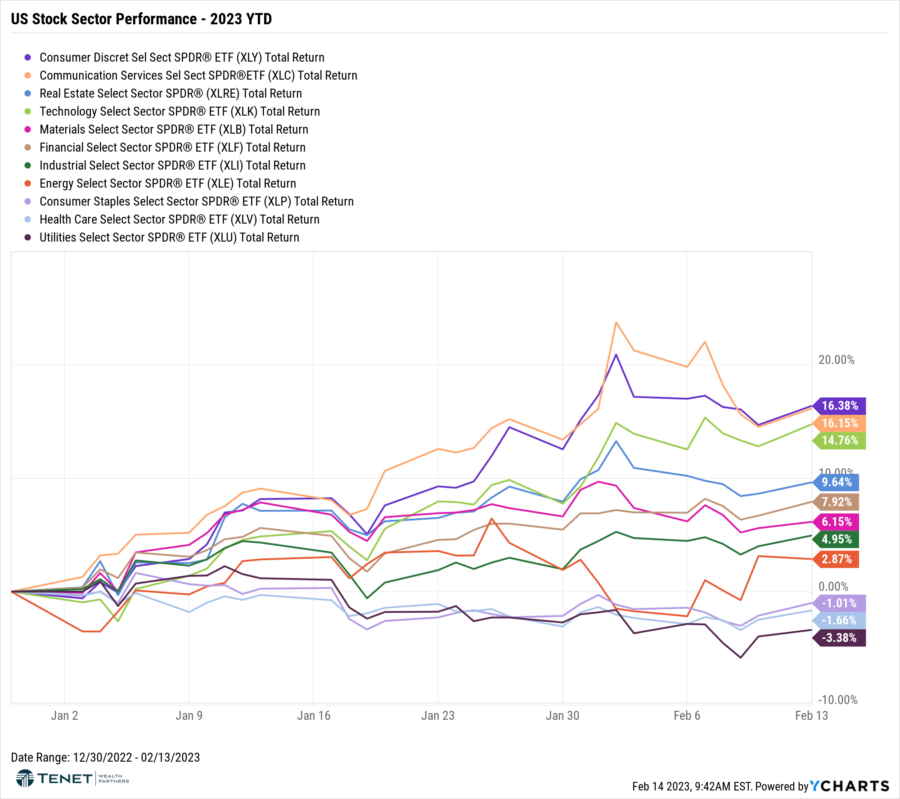
Consumer Discretionary is leading the way this year. Going from “worst to first” compared with 2022.
Communications and Tech sector stocks were the next best, while the largest detractors (and only sectors in the red so far) this year have been Utilities, Healthcare, and Consumer Staples.
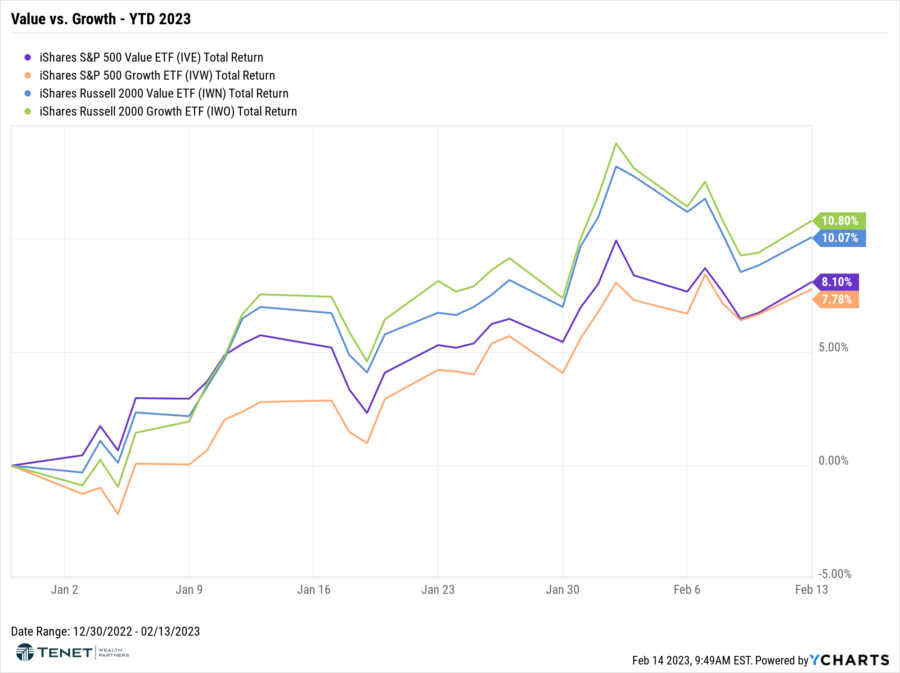
While Value far outpaced Growth in 2022, we have seen more balanced and even performance between the two in 2023 so far. Small Cap (Russell 2000)
Growth is slightly outperforming Small Cap Value this year, while Large Cap Value is outperforming Large Cap Growth by an even smaller margin.
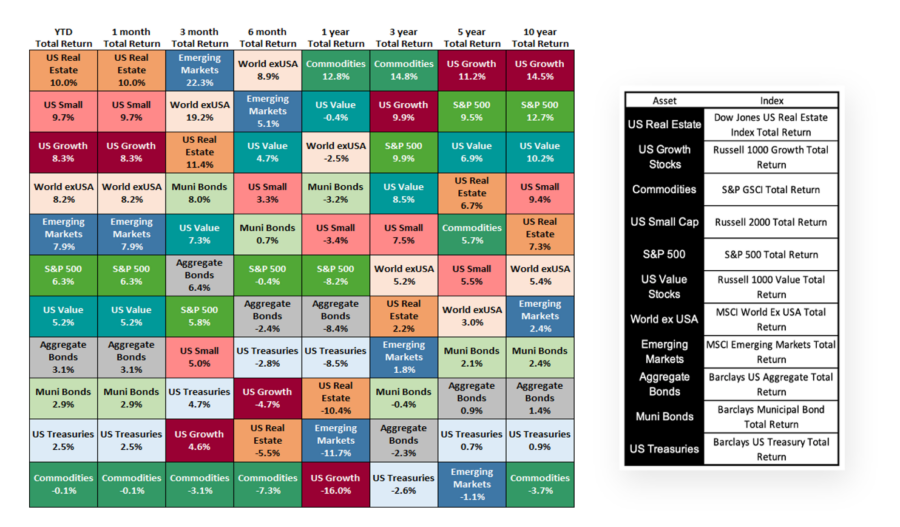
After being one of the worst performers of 2022 (down over 25%), US Real Estate is now one of the top performers to start the year.
Developed International (World ex USA) and Emerging Market stocks have also started the year strong with returns near 8%, continuing to outperform their US counterparts (S&P 500).
Aggregate bonds, as well as Municipal Bonds, have also started the year strong with returns near 3%, after one of their worst years on record in 2022.
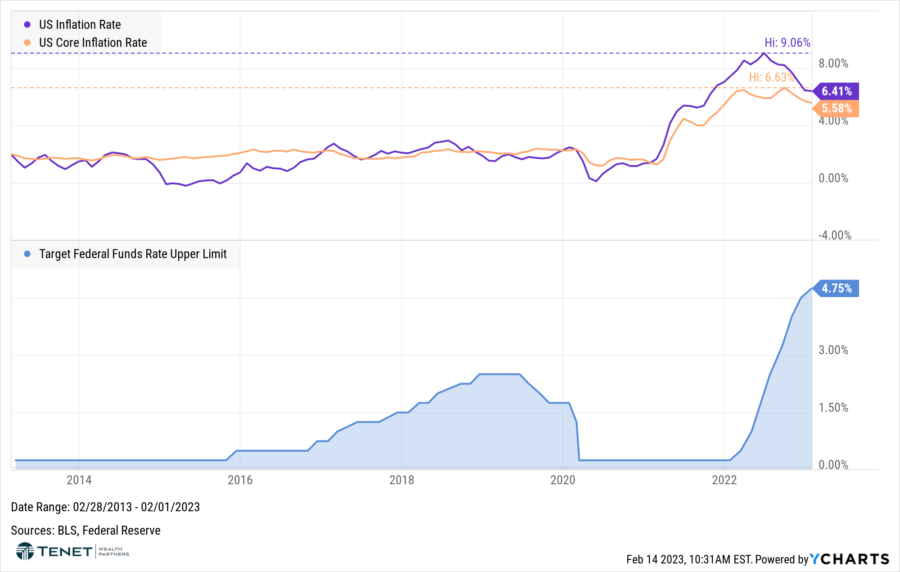
The Fed’s battle against inflation continues as they recently increased rates again, albeit by a smaller margin (0.25%). Many analysts and economists believe they will continue to slow their rate hikes, and eventually stop, sometime in Q1/Q2 of this year.
This expectation is driven by the fact that inflation has been steadily cooling over the last several months from its 9%+ high last year (now down to 6.4%). The most recent CPI report for January (released 2/14) showed inflation increased 0.5% in January, which is slightly higher than the expected reading of 0.4%. The increase was mainly driven by increases in shelter, food, and energy; however, it is expected that the lagging shelter data showing a slowdown in home prices and rents should begin to translate to the CPI report print later this year. This is key because Shelter prices make up approximately 33% of CPI.
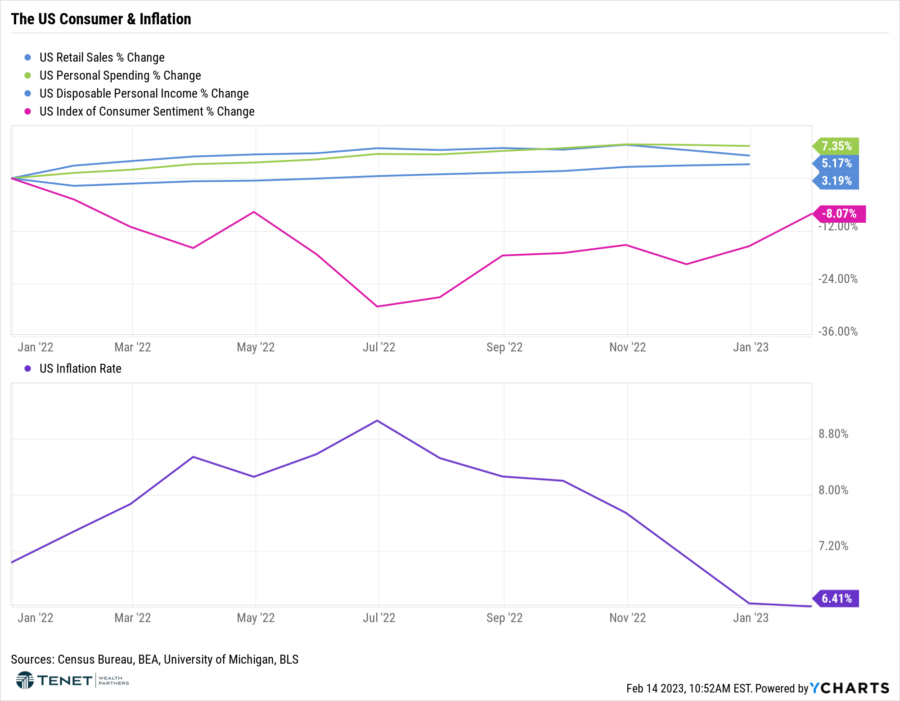
Consumers are both continuing to spend in the face of stubborn inflation AND are becoming more confident over the last few months (as evidenced by the Consumer Sentiment Index).
The offset of higher prices appears to be a higher level of disposable personal income, which is driven by continued wage growth.
While wage growth is good on the surface, this is another “sticky” component of inflation that the Fed watches closely and may dictate part of their decision making when it comes to future rate hikes.
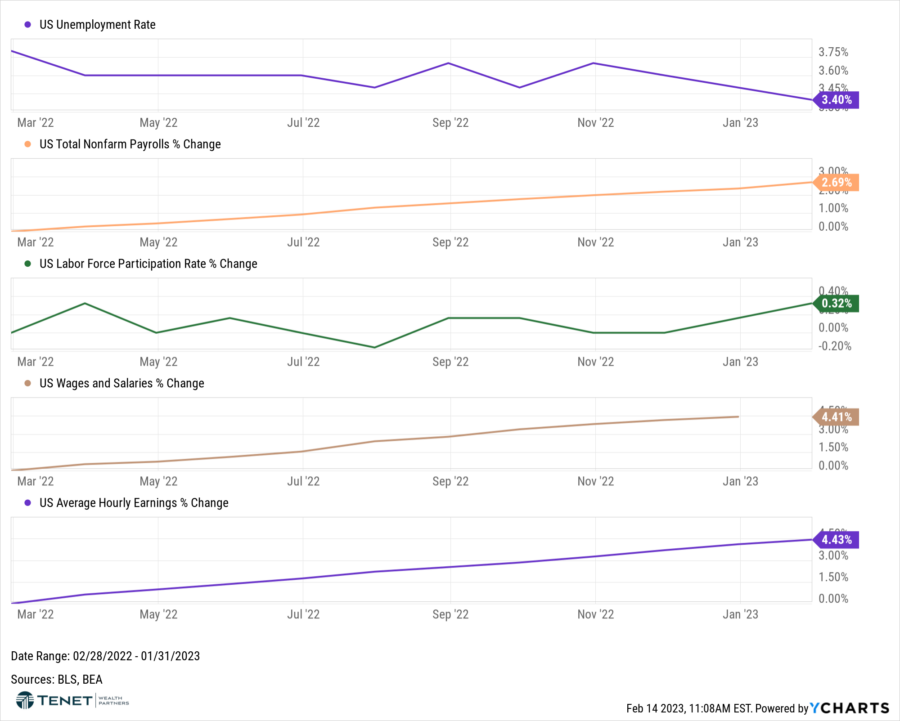
U.S. job growth accelerated sharply in January, pointing to a stubbornly tight labor market and a potential headache for Federal Reserve officials as they fight inflation. The Labor Department’s employment report also showed job creation in the past year was much stronger than previously estimated, suggesting the economy is nowhere near a recession.
With that being said, this is another “good news is bad news” situation when it comes to inflation, especially when looking at wage growth. While wage inflation continued to cool further in January, average hourly earnings increased at a quicker-than-expected pace in 2022. This dampens market expectations that the Federal Reserve is getting closer to pausing its monetary policy tightening cycle.
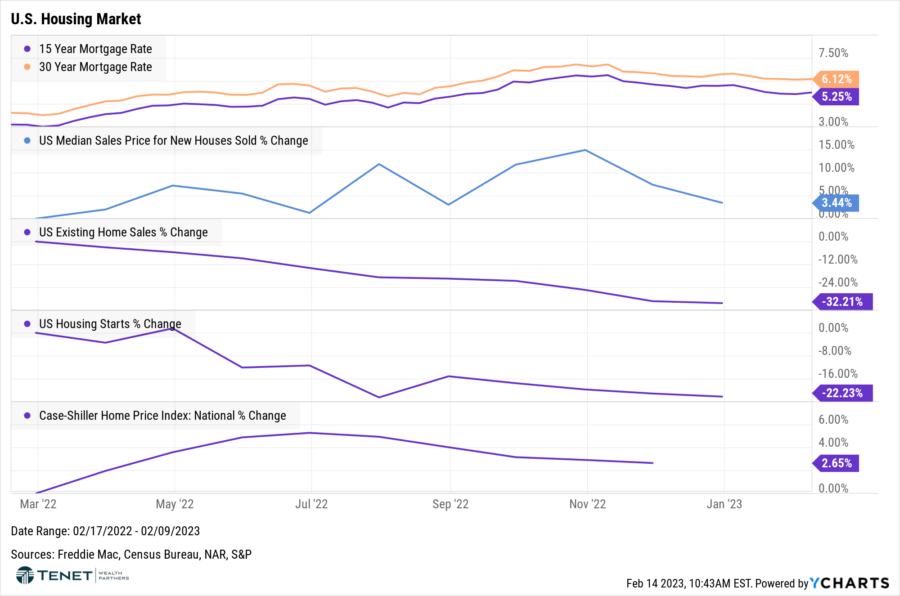
Home sales and prices continue to fall from their previous highs, which should eventually translate to a drop in Shelter inflation in the coming months.
However, mortgage rates have also fallen slightly from their highs in October/November 2022. It remains to be seen if this will have an impact on home sales/prices or not.
According to FactSet, the bottom-up target price target for the S&P 500 over the next 12 months is 4554, which is ~9% above the closing price of 4164. At the sector level, the Energy (+18.1%) sector is expected to see the largest price increase. On the other hand, the Real Estate (3.8%) and Materials (+4.6%) sectors are expected to see the smallest price increases.
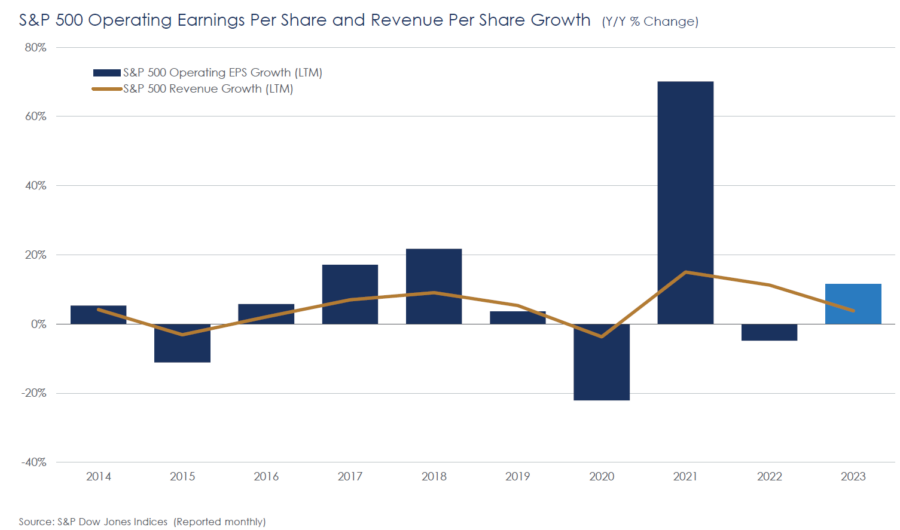
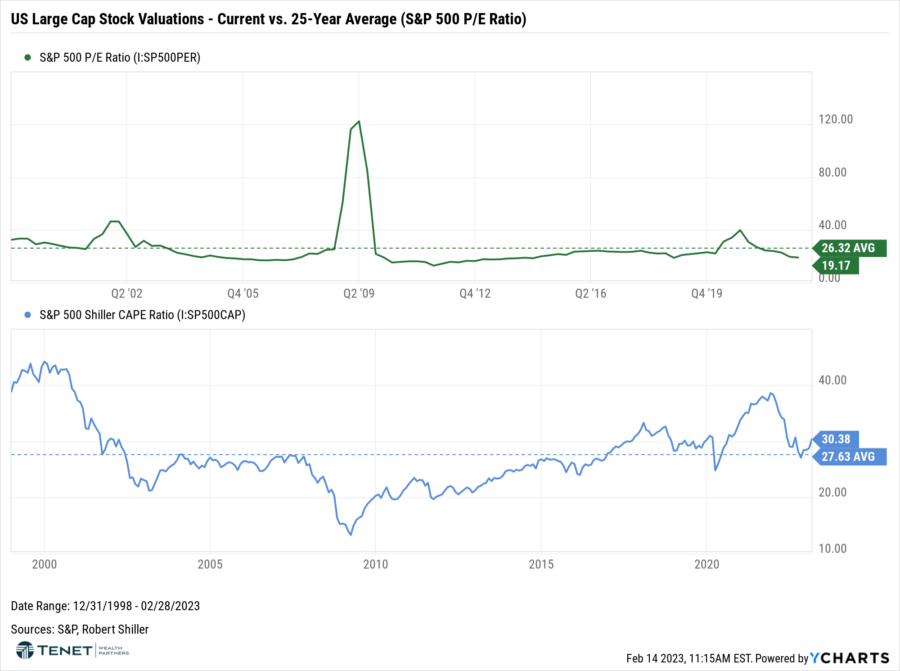
Even with the recent uptick in stock prices to start the year, valuations remain fairly in line with 25-year averages. While not technically a “buyer’s market” across the board, this does provide confidence that the broader US stock market is not excessively overvalued and corporate earnings remain resilient.
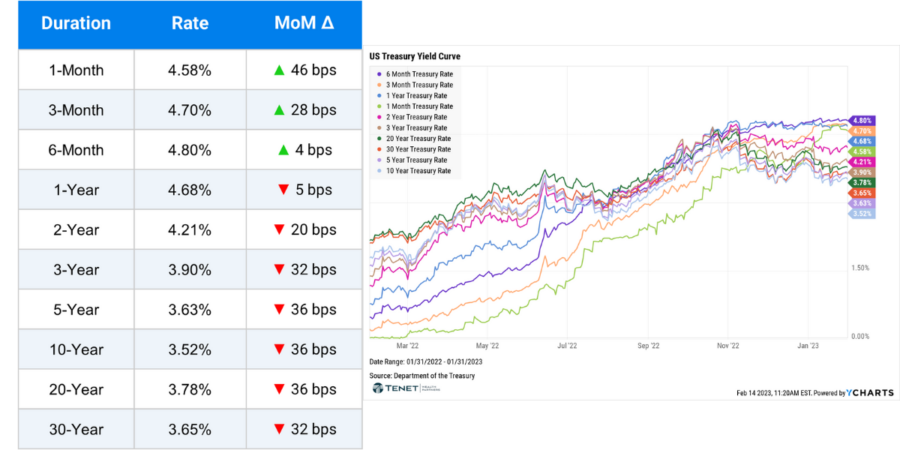
Short-term interest rates continue to remain attractive compared with longer-term bonds, which illustrates that the yield curve remains inverted.
From a performance standpoint, short-term bond prices have fallen while intermediate-long term bond prices have increased this year. This outperformance of intermediate-long term bonds versus shorter-term bonds is a reversal from last year when short-term bonds far outpaced their intermediate-long counterparts.
If the Fed slows its rate hike cycle in the coming months and these rate levels peak, bond returns may get a boost if investors seek to lock in these higher rates.
Registered Representative of Sanctuary Securities Inc. and Investment Advisor Representative of Sanctuary Advisors, LLC. Securities offered through Sanctuary Securities, Inc., Member FINRA, SIPC. Advisory services offered through Sanctuary Advisors, LLC., a SEC Registered Investment Advisor. Tenet Wealth Partners is a DBA of Sanctuary Securities, Inc. and Sanctuary Advisors, LLC. The information provided in this communication was sourced by Tenet Wealth Partners through public information and public channels and is in no way proprietary to Tenet Wealth Partners, nor is the information provided Tenet Wealth Partner’s position, recommendation or investment advice. Tenet makes no representations as to the accuracy and completeness of information provided herein. Any investment discussed may not be suitable for all investors. Investors must make their own decisions based on their specific investment objectives and financial circumstances. Additional information available upon request. This material is provided for informational/educational purposes only. This material is not intended to constitute legal, tax, investment or financial advice. Investments are subject to risk, including but not limited to market and interest rate fluctuations. Any performance data represents past performance which is no guarantee of future results. Prices/yields/figures mentioned herein are as of the date noted unless indicated otherwise. All figures subject to market fluctuation and change. Additional information available upon request.
About The Author
Kevan Melchiorre, CFP®Co-Founder & Managing Partner
Kevan Melchiorre co-founded Tenet Wealth Partners in 2021 with a focus on delivering a premier client experience, supported by an innovative and fully integrated approach to wealth planning. As a CERTIFIED FINANCIAL PLANNER® practitioner with over 16 years of wealth management experience, Kevan partners with affluent individuals, families, and institutions to help align their capital […]
Learn more about Kevan