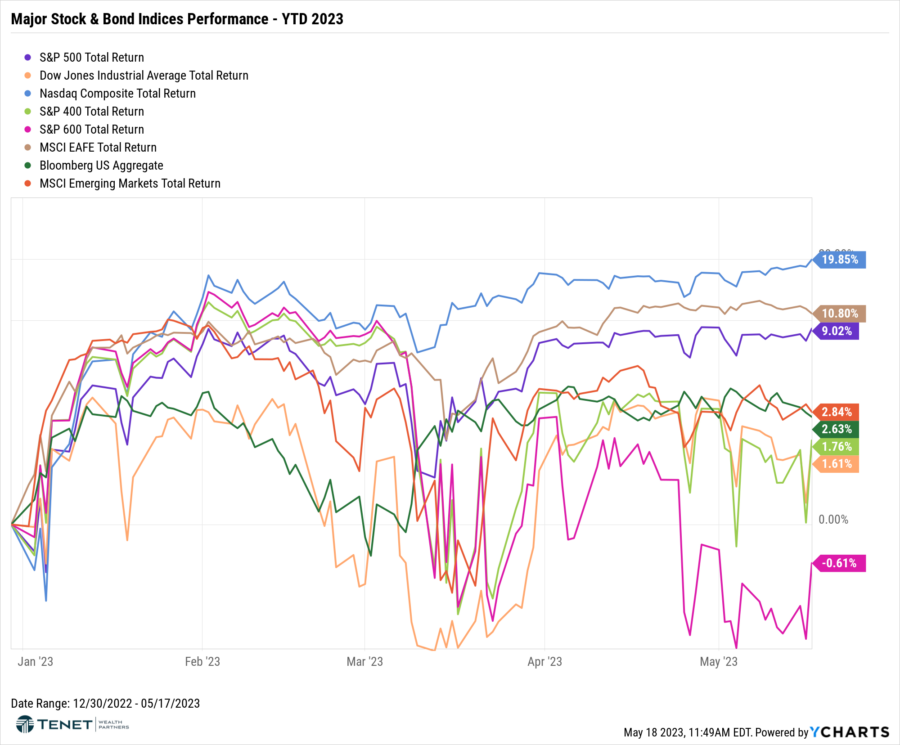
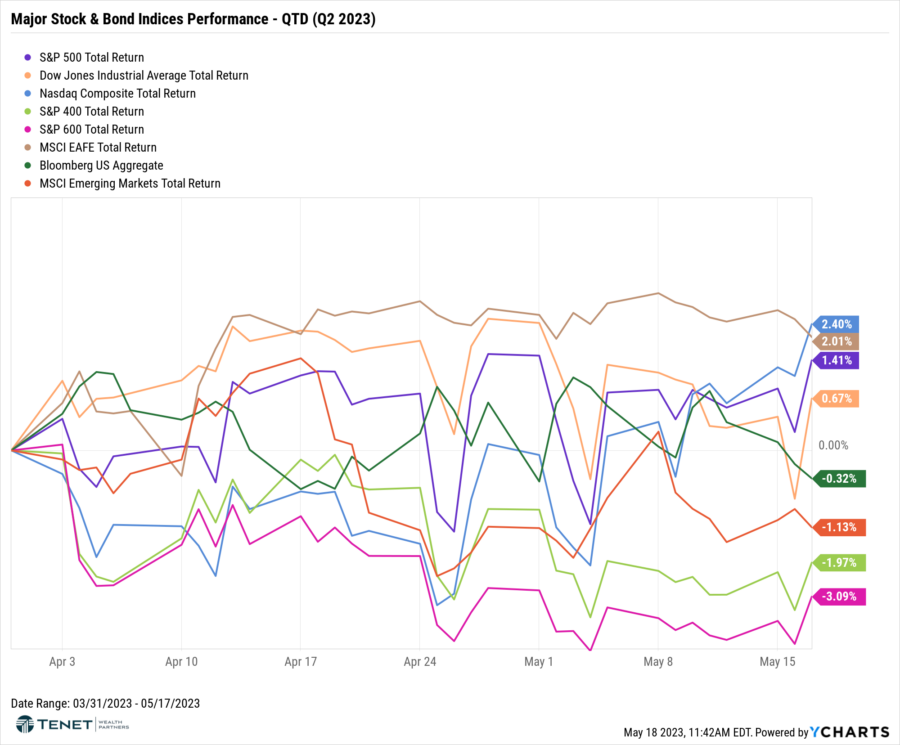
Major Index Returns – QTD & YTD 2023
Markets have been mixed early on in Q2. U.S. Small Cap and Mid Cap stocks (S&P 600 and S&P 400) as well as Emerging Markets stocks have been the biggest laggards thus far, while U.S. Large Cap and International Developed stocks have shown strength with positive results.
Year-to-date, the NASDAQ Composite Index maintained its leadership position, delivering exceptional results on the backs on the index’s two largest sectors, Technology and Communications Services, which are up 24% and 27%, respectively for the year. After a strong 2022, Energy has struggled this year down over 9%, while the other detracting sectors include Utilities and Financials.
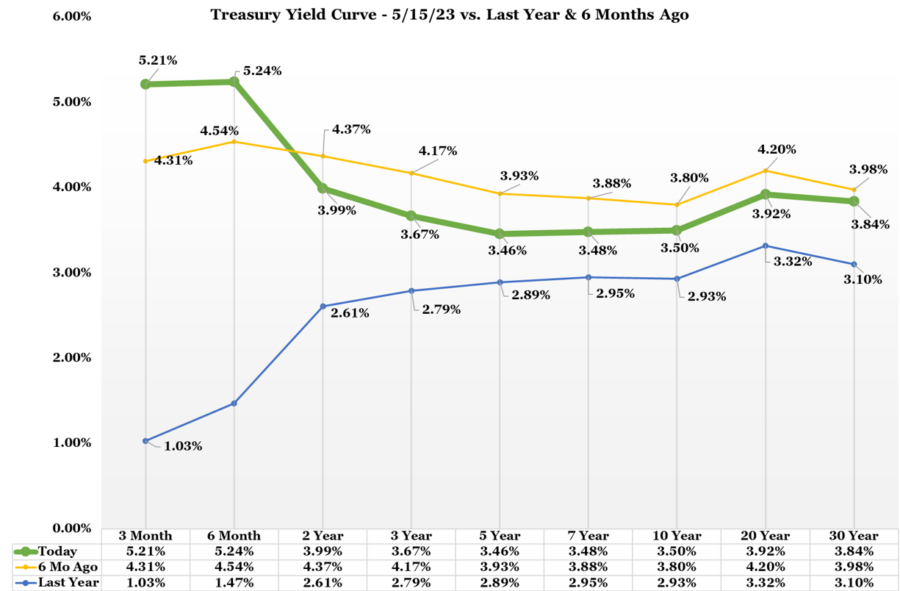
Bond Yields
Compared to the volatility seen in March, we have seen a much calmer and less volatile month for fixed income markets. Having rallied sharply in response to the collapse of Silicon Valley Bank in March, interest rate expectations drifted higher during April as the situation appeared to have been contained and the focus turned back to the economic outlook. The yield on the benchmark 10-year U.S. Treasury (as of 5/17) is at 3.50%, which is much higher than the 2.93% we saw this time last year but lower than the 3.80% yield we saw 6 months ago. Additionally, while the yield curve is still inverted with the 10-year remaining firmly above the 2-year, the level of inversion did fall slightly compared to 6 months ago.

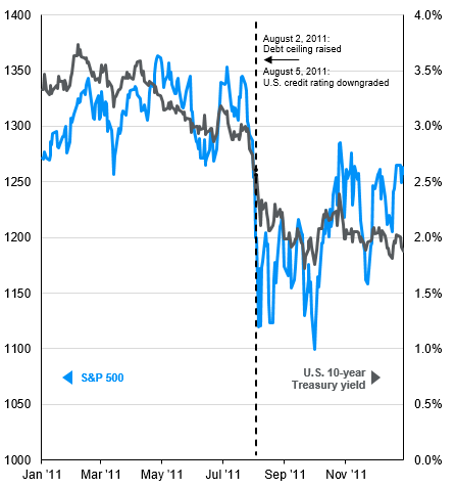
Debt Ceiling Concerns
Market performance around U.S. credit downgrade
Recent developments indicate that the White House and congressional leaders are inching closer to a deal to avoid a default. In fact, new comments made by House Speaker McCarthy signal that the House could vote on a debt ceiling deal as soon as next week. However, what does it mean for markets if a deal is not secured and the U.S. defaults? While there is no direct comparison as this has never happened, the closest is the 2011 debt ceiling standoff and subsequent credit rating downgrade. As highlighted in the chart below, equities faced considerable volatility leading up to the debt ceiling being raised and the credit rating downgrade, but afterwards saw a positive rally of nearly 6% from that point until year-end. Bonds also generated a positive return of nearly 3% as yields fell.
Interesting fact: Lawmakers have raised or suspended the debt ceiling over one hundred times since WWII and under every president since 1959.
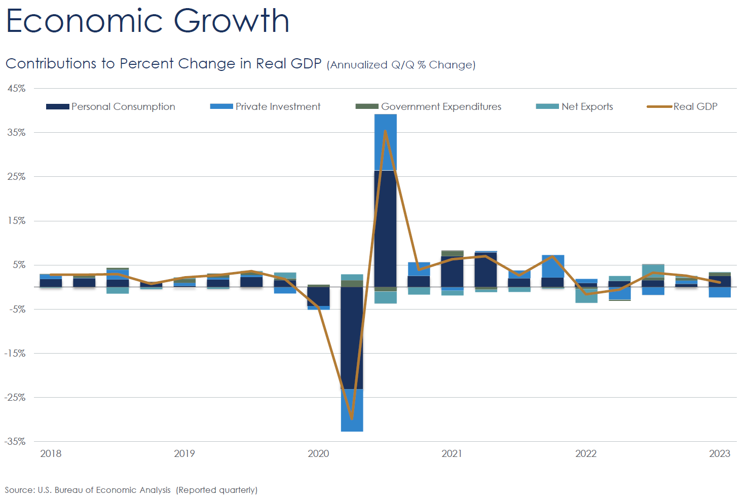
Economic Growth
Contributions to Percent Change in Real GDP
According to the Commerce Department, Q1 2023 U.S. real GDP expanded at an annualized rate of 1.1%. However, the headline figure masks diverging trends; private consumption growth surged to 3.7% (annualized), up from just 1% in Q4 2022, but this was largely offset by a steep decline in private inventory investment. U.S. economic data was mixed throughout the first quarter, suggesting that the U.S. economy is at a turning point and heading into a slowdown. These mixed signals complicate the task facing the Federal Reserve as it seeks to reduce inflation without unnecessarily deepening the slowdown.
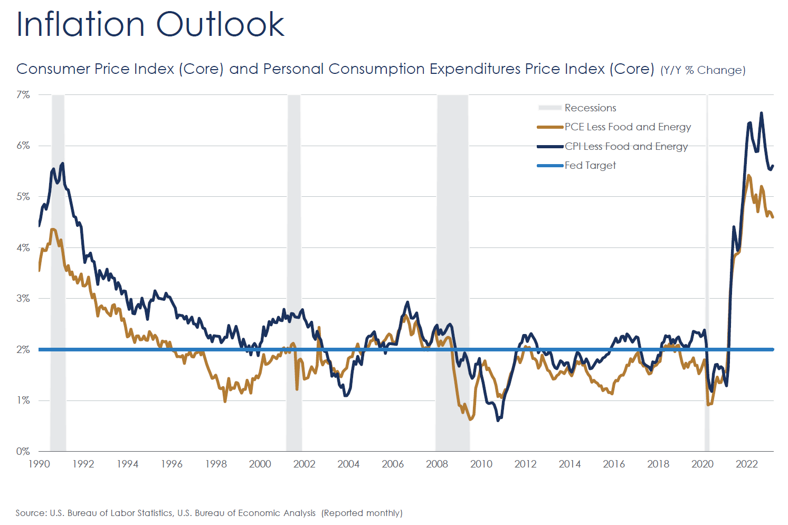
Inflation Outlook
The pace of consumer price increases eased again in March compared with a year earlier. However, economists believe progress may have stalled, as higher prices for core goods counteract cooling costs elsewhere. The rate of inflation has been dropping every month since hitting 9.1% in June last year. While price rises in core services — a category which includes rent and transportation — are expected to slow, analysts expect core goods inflation to be higher, driven by the rising price of used cars.
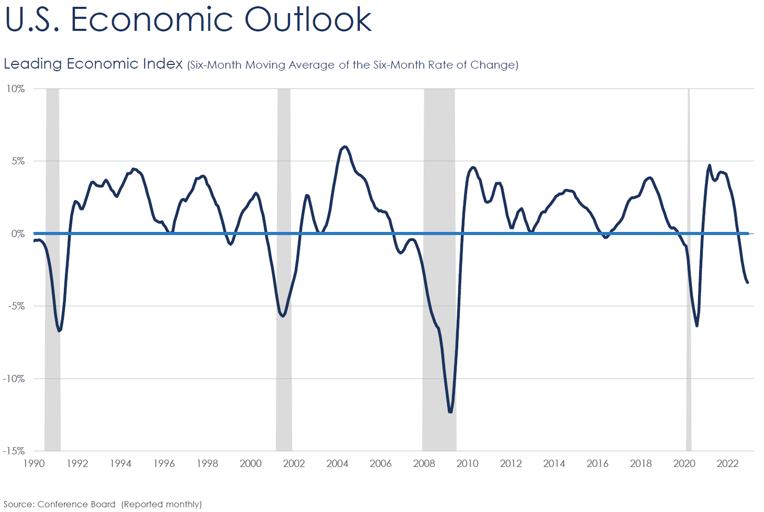
U.S. Economic Outlook
According to the Conference Board, the U.S. LEI fell to its lowest level since November of 2020, consistent with worsening economic conditions ahead. The weaknesses among the index’s components were widespread in March and have been so over the past six months, which pushed the growth rate of the LEI deeper into negative territory. The Conference Board forecasts that economic weakness will increase and spread more broadly throughout the U.S. economy over the coming months.
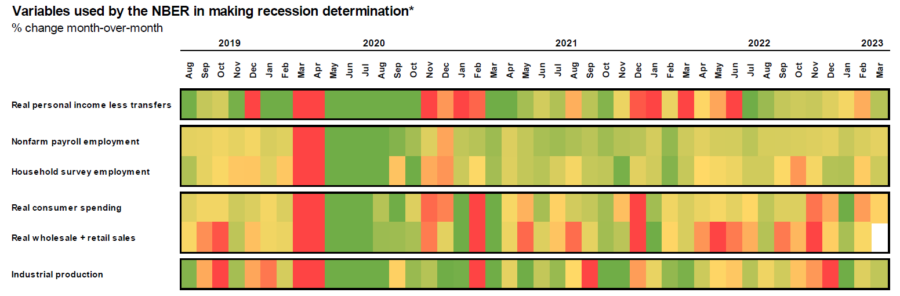
Recession Determinants
Is a recession looming?
While the Leading Economic Index portends worsening conditions, data points tracked by NBER (the National Bureau of Economic Research) indicate that a recession is not imminent. Employment, real personal income, and industrial production remain strong, while consumer spending continues to show resiliency in the face of still-heightened inflation.
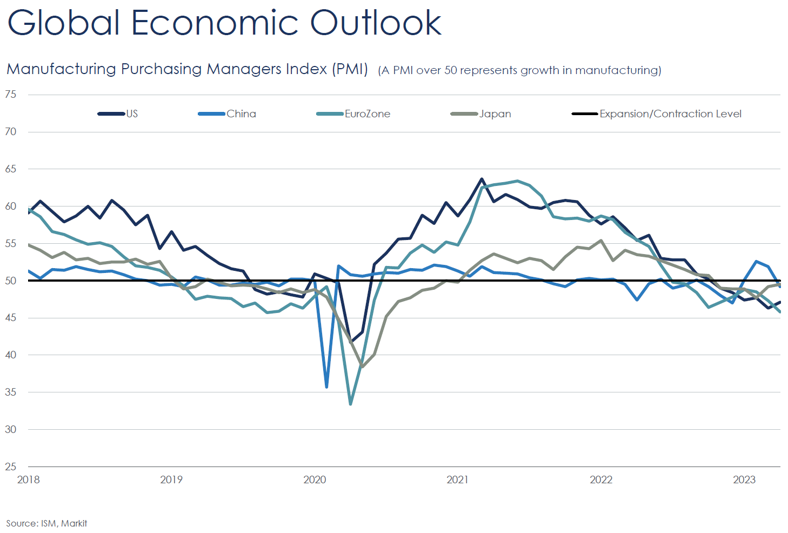
Global Economic Outlook
The April PMI surveys saw a further marginal increase in global manufacturing production, as improved supply-chain conditions and the clearance of existing backlogs offset weaker demand. Underlying details of the survey suggest that growth is being held back by softening investment spending and a continued drag from inventories.
Corporate Profitability
According to FactSet, the bottom-up target price target for the S&P 500 over the next 12 months is 4,689, which is 13.4% above the 5/15 closing price of 4,136. For Q1 2023 (with 92% of S&P 500 companies reporting actual results), 78% of companies have reported a positive EPS surprise and 75% have reported a positive revenue surprise, which is their best performance relative to analyst expectations since Q4 2021. For Q2 2023, 50 S&P 500 companies have issued negative EPS guidance while 37 have issued positive EPS guidance. However, the index is still reporting a year-over-year decline in earnings for the second straight quarter.
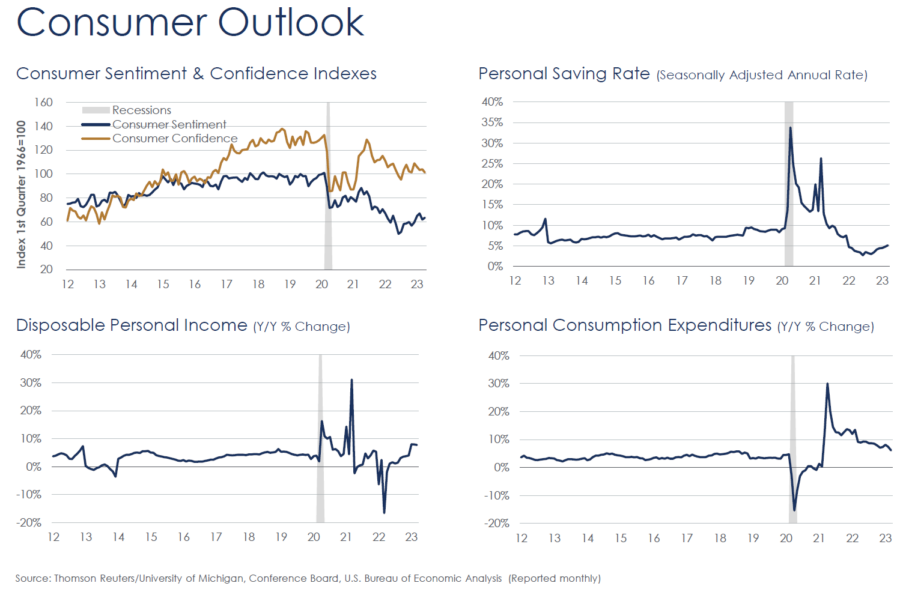
Consumer Health & Outlook
According to the Conference Board, while consumers’ assessment of the current business environment improved in April, their overall expectations fell and remain below the level which can signal a recession in the short-term. April’s results show consumer inflation expectations over the next 12 months remain essentially unchanged yet elevated at 6.2% —although that level is down substantially from last year’s peak of 7.9%. Overall purchasing plans for homes, autos, appliances, and vacations all pulled back in April, a signal that consumers may be economizing amid growing pessimism.
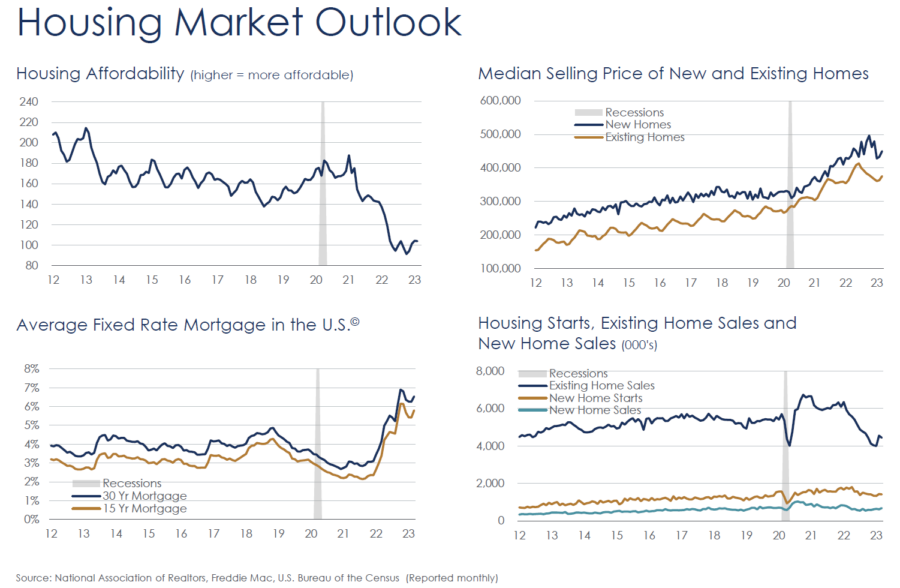
Housing Market Outlook
According to the National Association of Realtors, sales and prices are both down nationally but with inventory at historic lows and strong demand in certain price categories, there is still a good deal of competition for homes. Last month, 28% homes sold for above the list price. Overall, the inventories are sitting longer, but fresh listings are not popping into the market. This is due to the lock-in effect of homeowners who love their 3% interest rate.
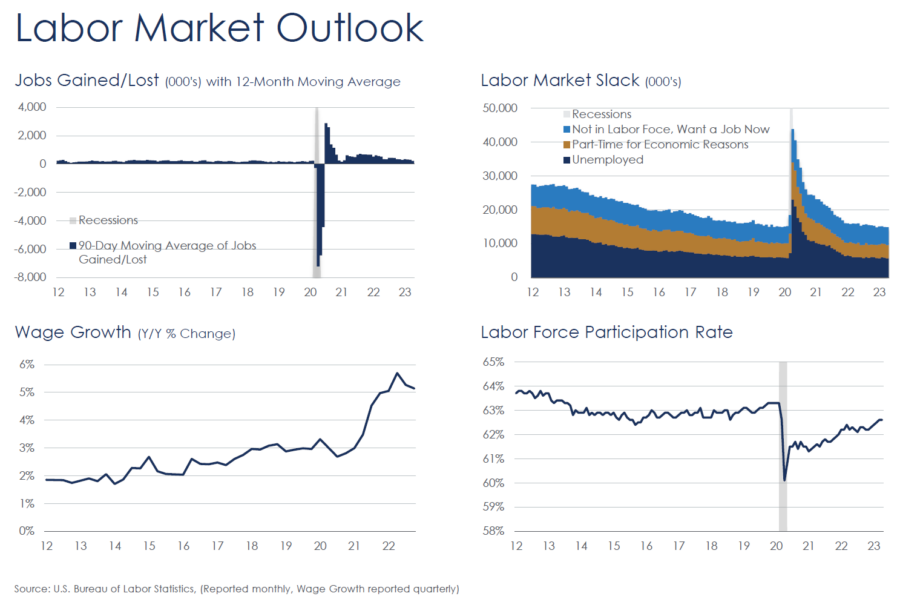
Job Market Outlook
Non-farm payrolls rose by 253,000 jobs last month and wage gains increased solidly, pointing to persistent labor market strength that could compel the Federal Reserve to keep interest rates higher for longer as it fights to bring inflation under control. The Labor Department’s employment report also showed the unemployment rate falling back to a 53-year low of 3.4%. Though data for February and March were revised sharply lower, the labor market is slowing only marginally.
Registered Representative of Sanctuary Securities Inc. and Investment Advisor Representative of Sanctuary Advisors, LLC. Securities offered through Sanctuary Securities, Inc., Member FINRA, SIPC. Advisory services offered through Sanctuary Advisors, LLC., a SEC Registered Investment Advisor. Tenet Wealth Partners is a DBA of Sanctuary Securities, Inc. and Sanctuary Advisors, LLC.The information provided in this communication was sourced by Tenet Wealth Partners through public information and public channels and is in no way proprietary to Tenet Wealth Partners, nor is the information provided Tenet Wealth Partner’s position, recommendation or investment advice. Tenet makes no representations as to the accuracy and completeness of information provided herein. Any investment discussed may not be suitable for all investors. Investors must make their own decisions based on their specific investment objectives and financial circumstances. Additional information available upon request.This material is provided for informational/educational purposes only. This material is not intended to constitute legal, tax, investment or financial advice. Investments are subject to risk, including but not limited to market and interest rate fluctuations. Any performance data represents past performance which is no guarantee of future results. Prices/yields/figures mentioned herein are as of the date noted unless indicated otherwise. All figures subject to market fluctuation and change. Additional information available upon request.
About The Author
Kevan Melchiorre, CFP®Co-Founder & Managing Partner
Kevan Melchiorre co-founded Tenet Wealth Partners in 2021 with a focus on delivering a premier client experience, supported by an innovative and fully integrated approach to wealth planning. As a CERTIFIED FINANCIAL PLANNER® practitioner with over 16 years of wealth management experience, Kevan partners with affluent individuals, families, and institutions to help align their capital […]
Learn more about Kevan