Recession Fears Abound – Are we there yet? And if so, what does a recession mean for me as an investor?
While the word “inflation” (and actual higher prices themselves) has dominated concerns amongst consumers and investors this year, this has led us to a new word being talked about that is causing further concern: “Recession.” While we technically experienced a recession back in 2020, we haven’t seen a meaningful, prolonged recession since the Great Recession of 2008. That leaves many Americans not knowing exactly what a true recession is like and what it means for them. Even for those that did experience the Great Recession (and others before that), it is easy to forget how to define it and what the impacts may be for investors.
Before we get to that, let’s look at the technical definition of a recession: a period of temporary economic decline during which trade and industrial activity are reduced, generally identified by a fall in GDP in two successive quarters. A drop in economic activity over a six-month period seems reasonable, right? However, there is more to the story that needs to be considered. First off, it should be clarified that the government doesn’t “call” a recession. This is done by an independent, private body known as the National Bureau of Economic Research (NBER), and they have more loosely defined a recession as a “significant decline in economic activity” that lasts “for more than a few months.” Of course, clearer definitions are generally more favored, hence the specific “two quarters” definition that we often hear today. Technically speaking, we just met this definition after 2nd quarter GDP came in at -0.9% after a 1st quarter contraction of -1.6%.
So, are we in a recession? Beyond the “two quarters” definition, what are the other economic metrics telling us right now, and what did these look like during past recessions compared with today? Let’s take a look…
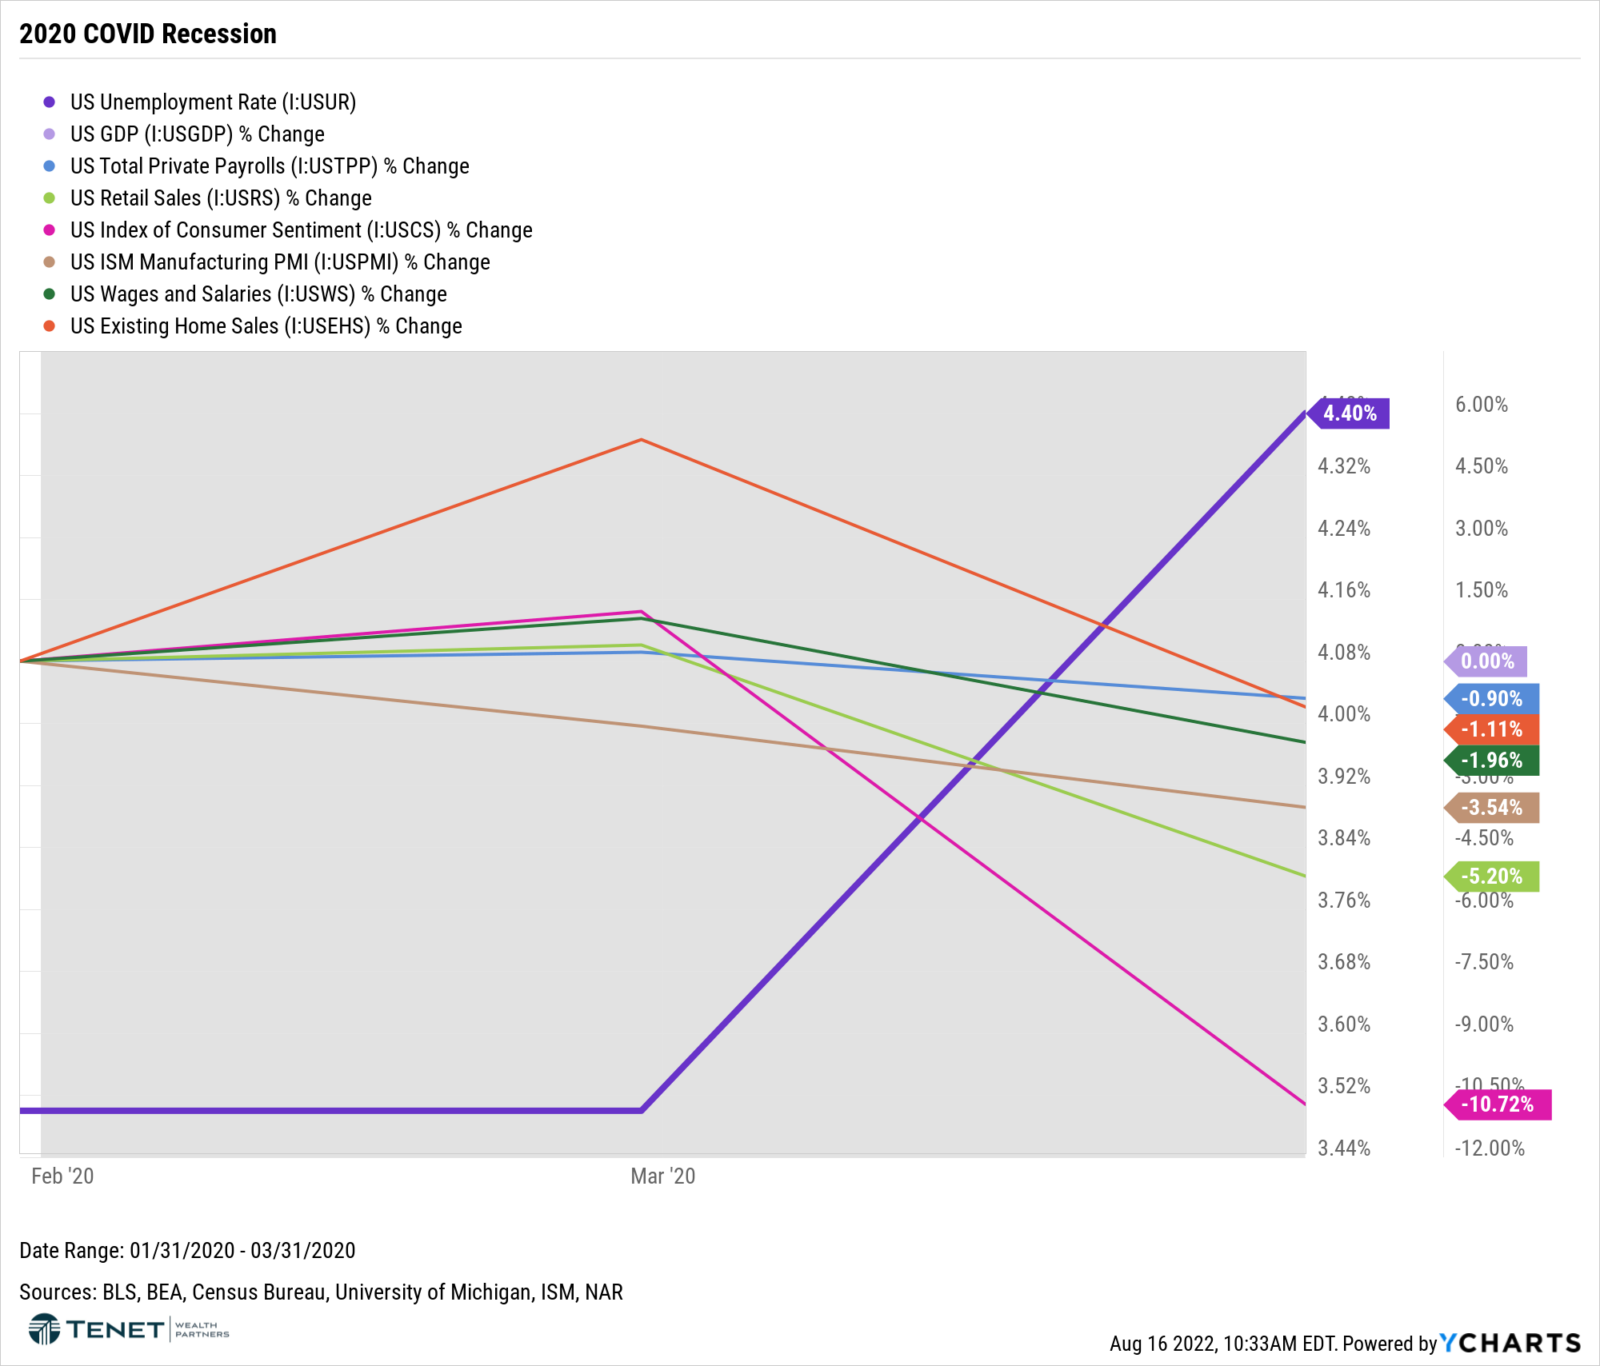
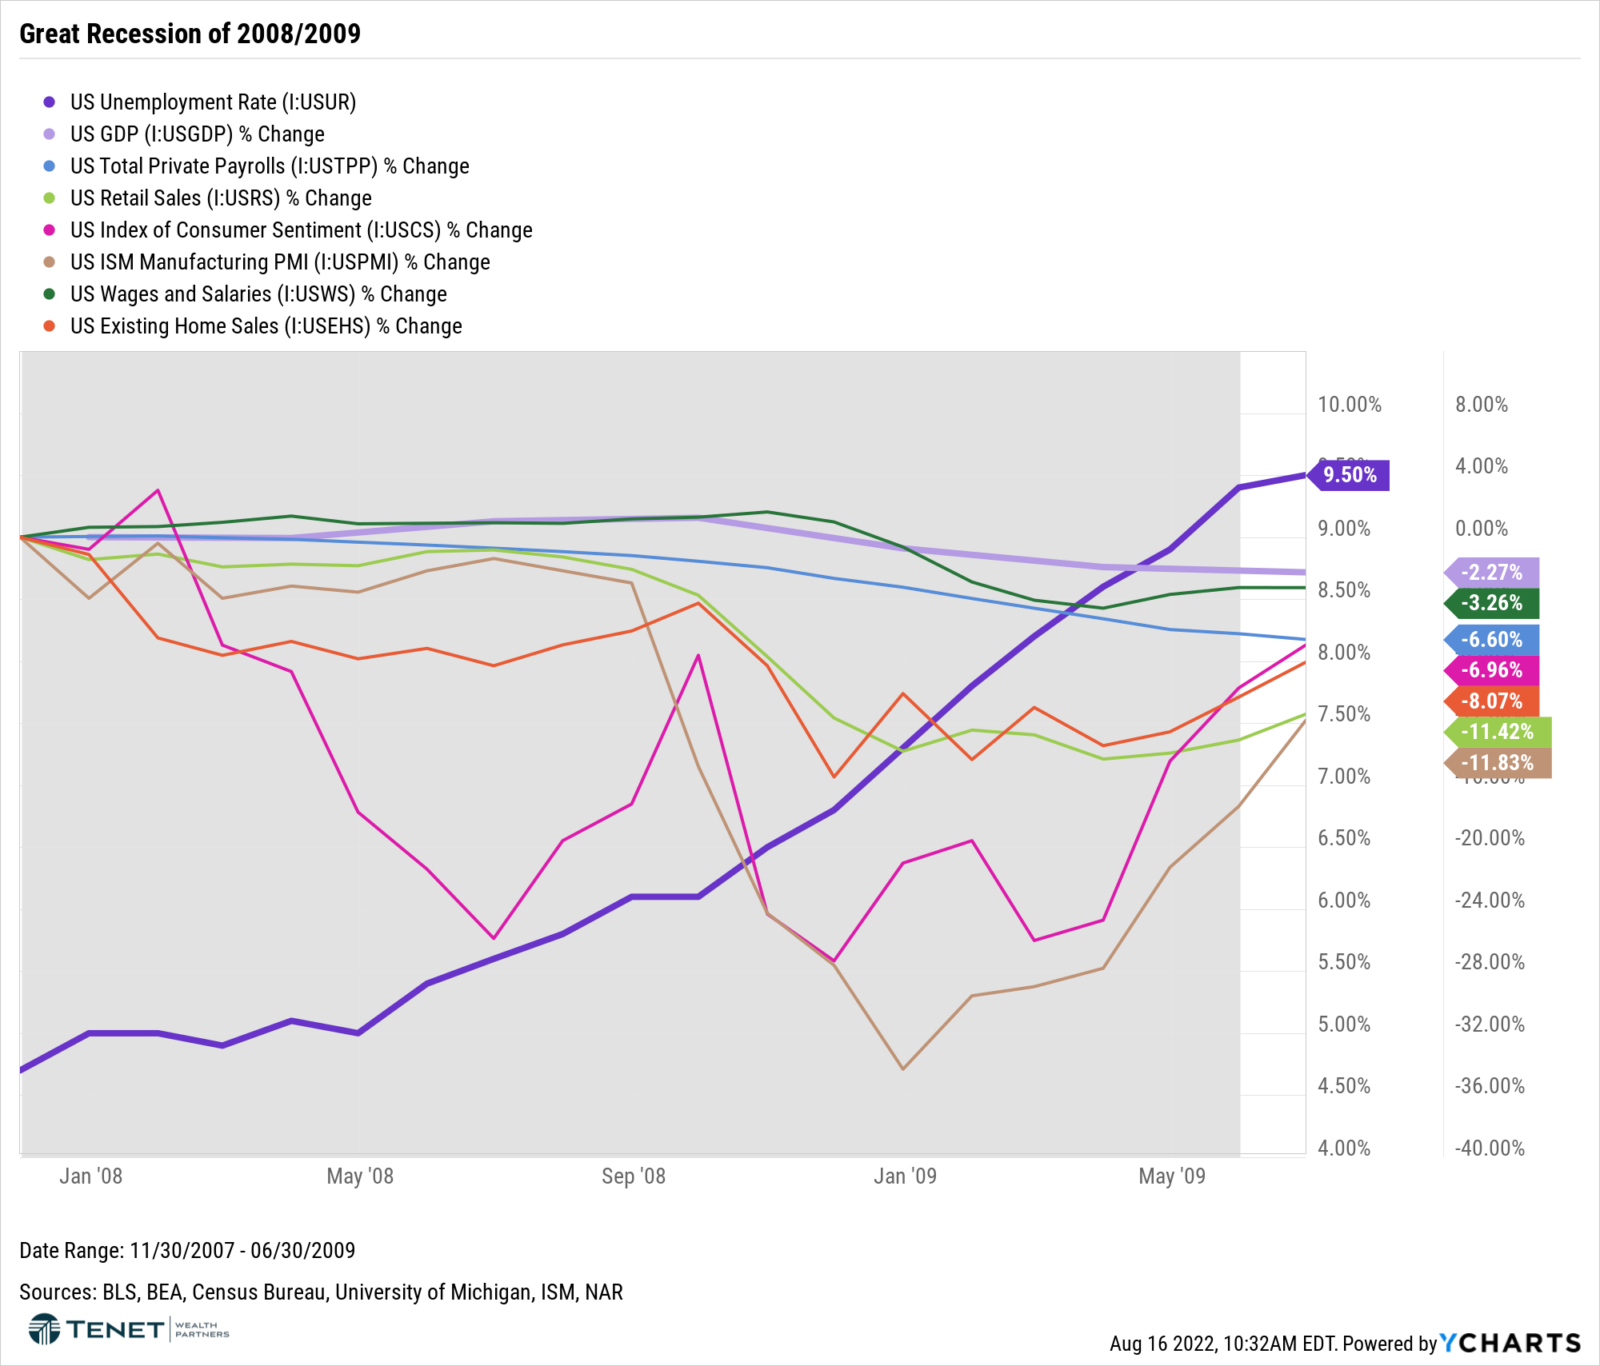
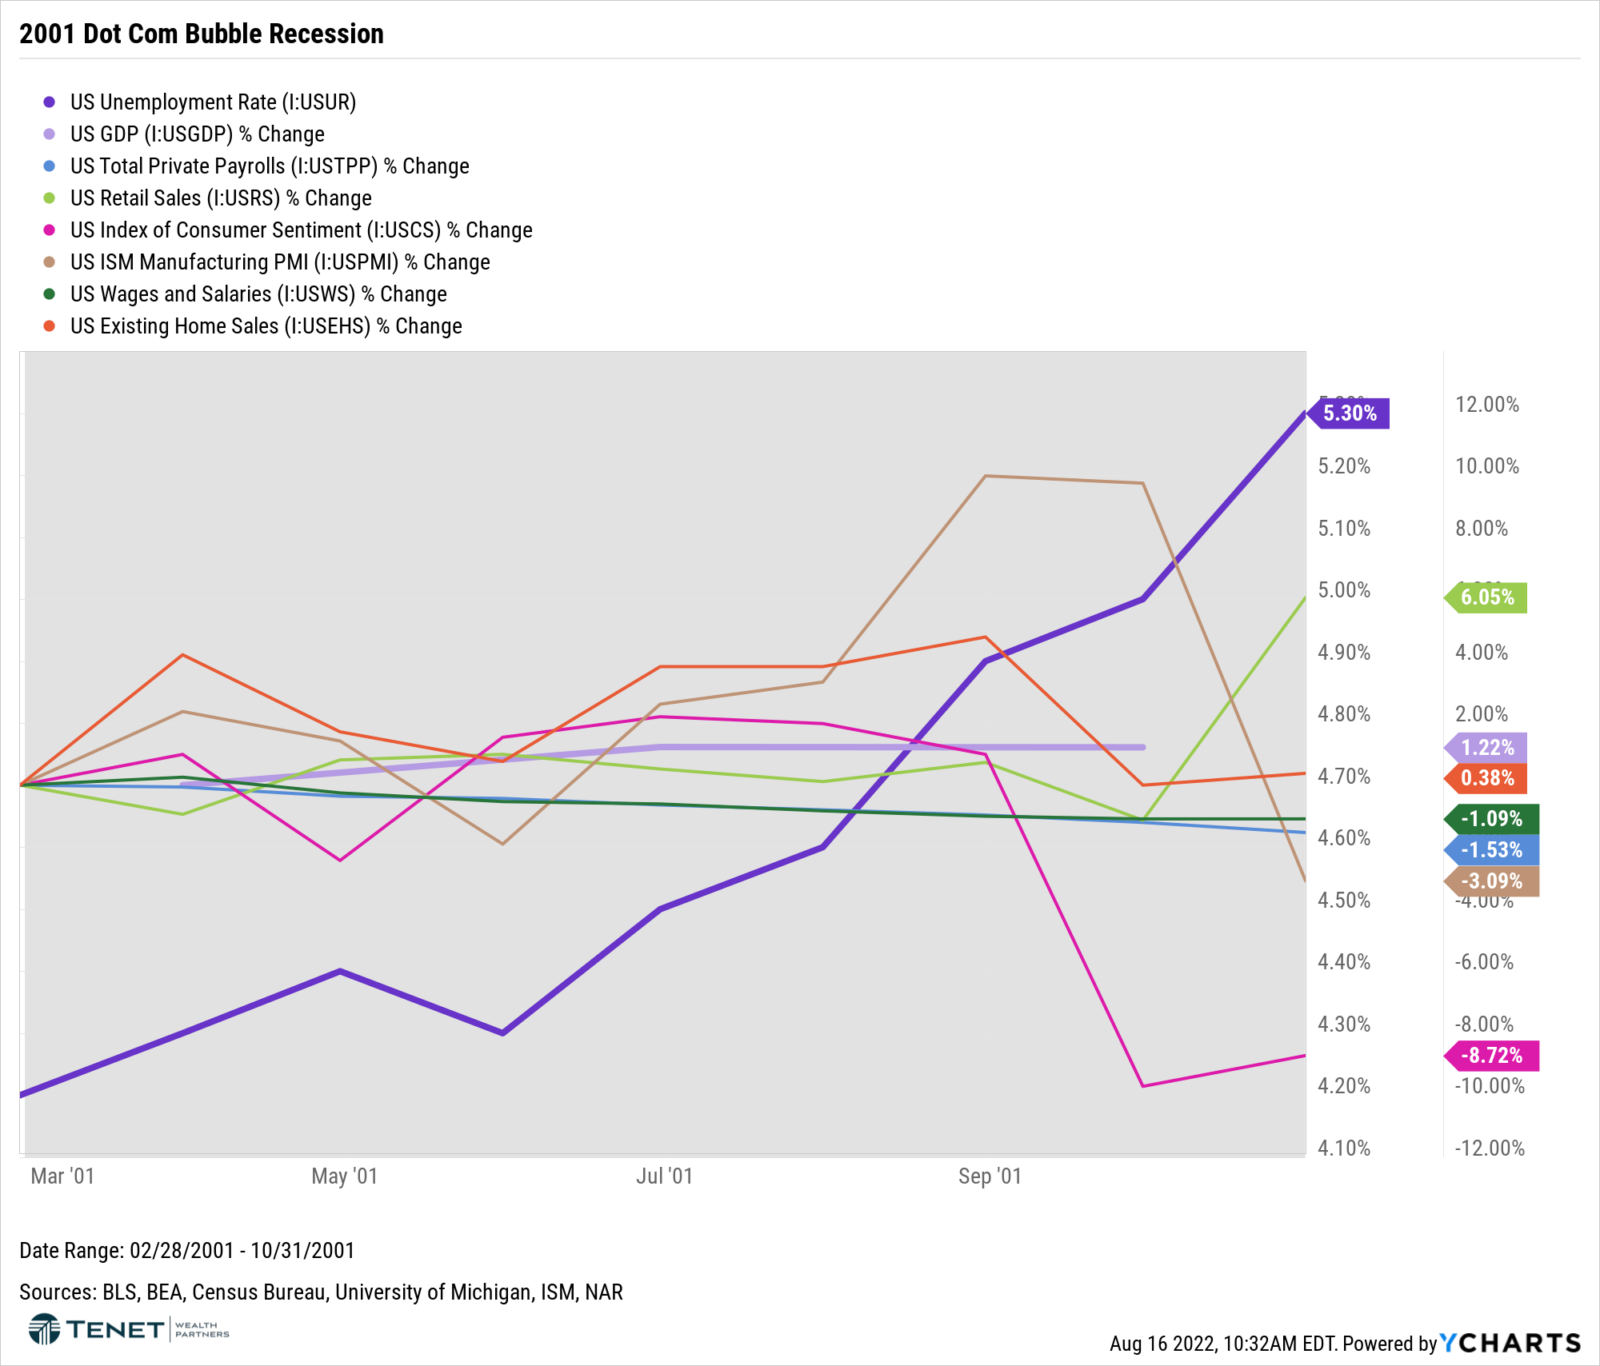
The following charts show major economic indicators and data points during the last three recessions: 2020, 2008, and 2001:
Here is the same data in the current environment (year-to-date):
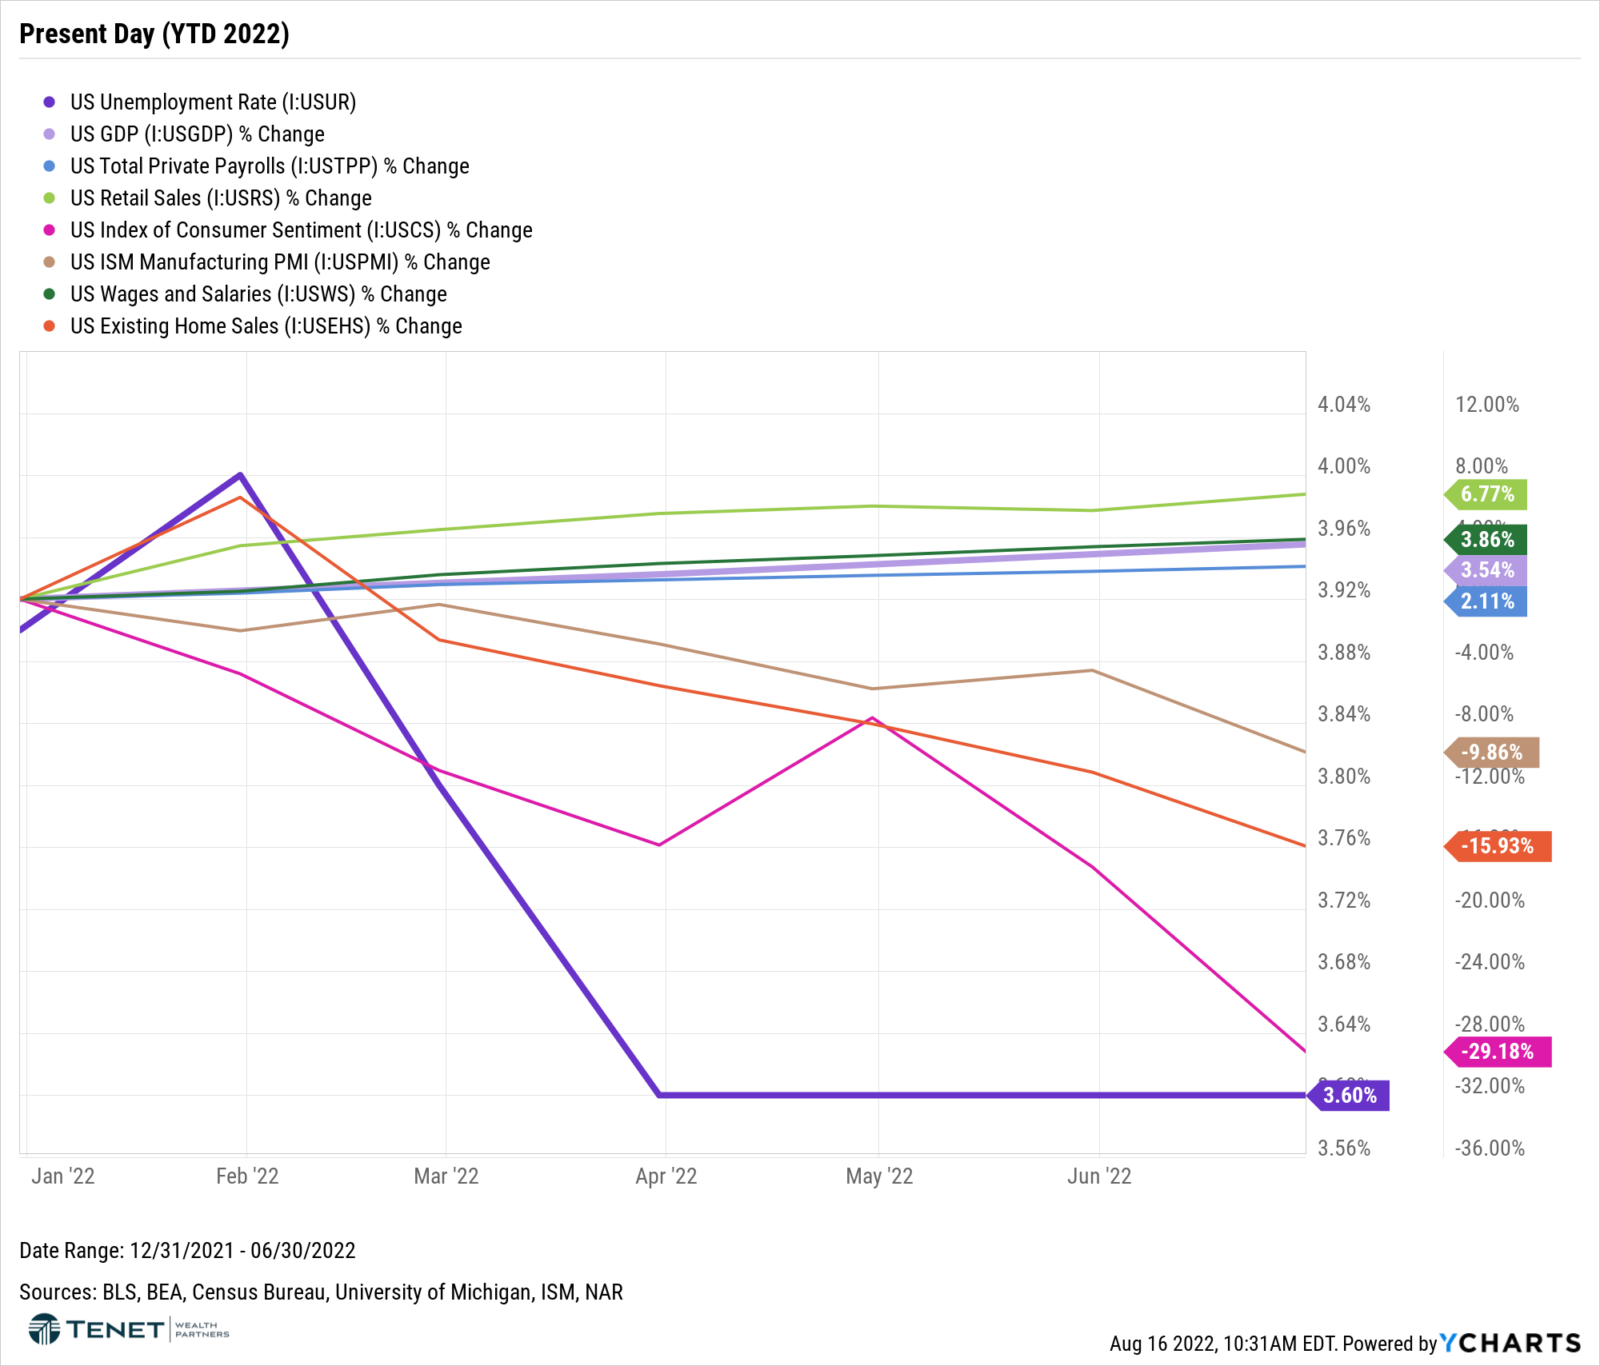
The big takeaway? Today’s economic environment is not consistent with the most recent recessions. The charts for each recession are fairly consistent, especially when you notice that we saw high unemployment, slowing job creation, lower wages, and lower overall spending during these periods. Right now, we are seeing solid wage growth and continued consumer spending. The job market is also showing signs of strength, both in terms of job creation and low unemployment. More specifically with respect to the labor market, the U.S. economy added 372,000 jobs in June, and then had a blowout reading of 528,000 for July. Job growth has been highest in the leisure and hospitality sector (translating to higher demand for travel and entertainment – not consistent with a recession), but we have been seeing more jobs across nearly all sectors as well. On the unemployment side, the rate stands at 3.6%. These are all signs of health and stability as opposed to weakness, which is what we would normally see during a recession.
One other important indicator that is not shown on these charts and supports the argument that we are not currently in a recession: Corporate Profits. When looking at the S&P 500 corporate profits, here are the growth rates over the last few recessions compared with today:
- 2001: -42.3%
- 2008/2009: -89%
- 2020: -11.7%
- Current/YTD: +0.02%
Based on all of this data, there isn’t clear evidence that screams recession right now. Is it possible that we could still enter a recession? Absolutely. However, we would categorize the current period more as “slowing growth,” largely driven by high inflation and subsequent Fed actions. On that note, we believe that inflation appears to have peaked in June, which should help influence the Fed to not hike at the same rate as we have seen recently. If a recession does come to fruition, we believe that it would be mild, mainly due to the underlying health of the consumer and corporate sector that we are seeing right now.
What would a recession mean for me as an investor?
“Recession” is a scary word for investors and rightfully creates concerns about how it would impact portfolios. So, what are the potential implications on portfolios if we do enter a recession?
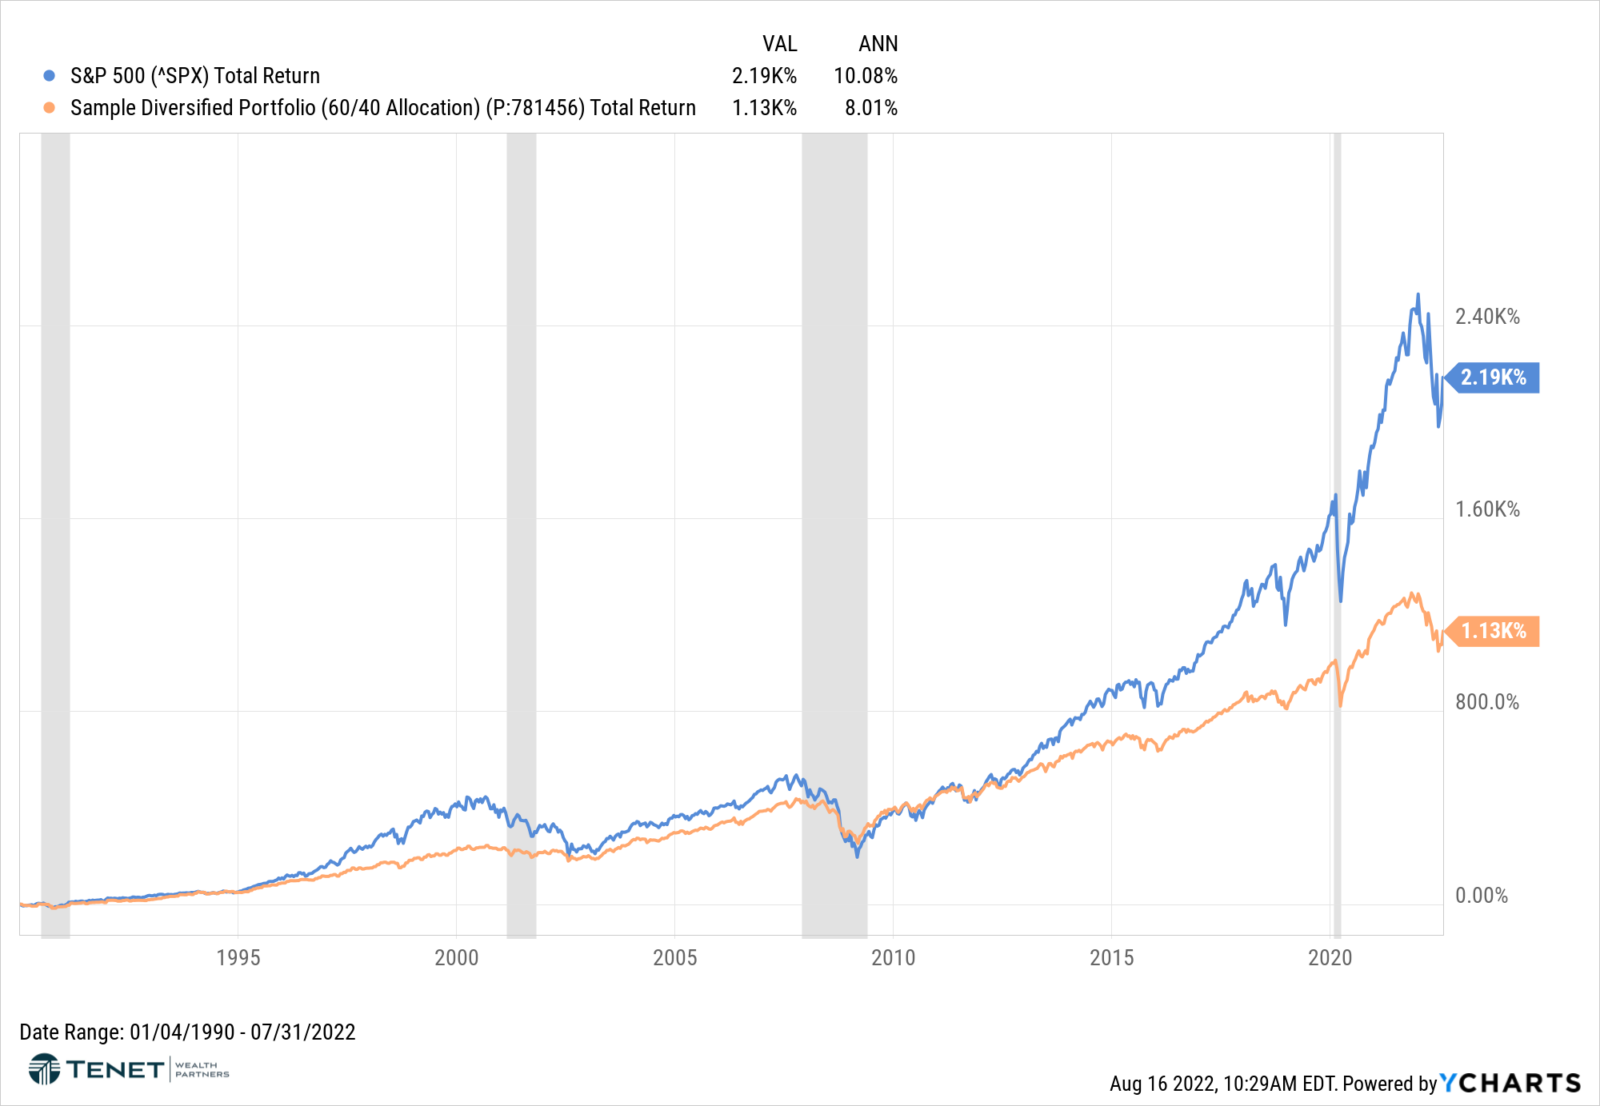
While history doesn’t tell us everything, it does give us at least some insight into potential outcomes. Here is a chart showing the long-term performance of the S&P 500 and a sample 60% stock, 40% bond portfolio since 1990. During this timeframe, we saw four recessions, and the market initially dropped during each of them. However, in all four cases, we saw an eventual return to positive returns over a longer time horizon. Both cumulative returns and annualized returns are shown at the top of the chart.
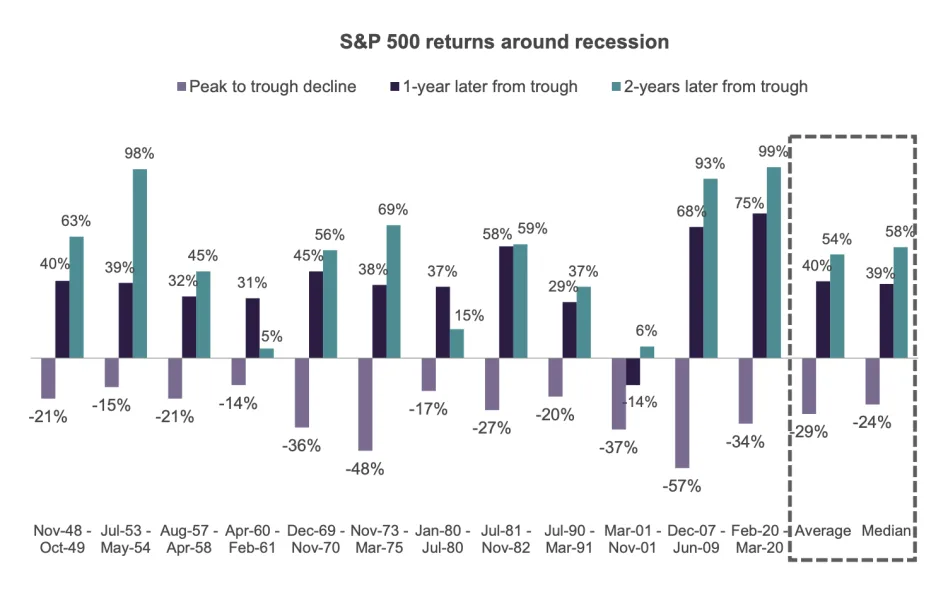
Additionally, the following chart shows the S&P 500 returns over the last 12 recessions, more specifically the peak-to-trough (i.e., top-to-bottom) decline (light purple), returns 1-year later (navy blue), and returns 2-years later (green).
While stocks did take a dive during each recession, they all showed a significant recovery after 1 year and then further growth after 2 years. In other words, stocks fell in the short-term but climbed shortly after, illustrating the importance of sticking with your investment strategy and letting a recovery benefit your portfolio.
So “are we there yet?” It doesn’t look like it, but we will continue to watch where the data trends from here. If a recession does happen, remember that remaining disciplined and patient has historically rewarded investors. As always, please feel free to reach out to our team with any questions!
Sources: YCharts, Sanctuary CIO Corner, National Bureau of Economic Research, Bureau of Economic Analysis, JP Morgan Asset Management, U.S. Bureau of Labor Statistics, Bloomberg, CNBC, Wall Street Journal, Robert Schiller, Census Bureau, University of Michigan, ISM, NAR, Yahoo!Finance
The information provided in this communication was sourced by Tenet Wealth Partners through public information and public channels and is in no way proprietary to Tenet Wealth Partners, nor is the information provided Tenet Wealth Partner’s position, recommendation or investment advice. This material is provided for informational/educational purposes only. This material is not intended to constitute legal, tax, investment or financial advice. Investments are subject to risk, including but not limited to market and interest rate fluctuations. Any performance data represents past performance which is no guarantee of future results. Prices/yields/figures mentioned herein are as of the date noted unless indicated otherwise. All figures subject to market fluctuation and change. Additional information available upon request. The “Sample Diversified Portfolio (60/40 Allocation) is comprised of the following total return indices and allocations: 40% S&P 500, 3% S&P 400, 4% S&P 600, 15% MSCI EAFE, 5% MSCI Emerging Markets, 40% Bloomberg US Aggregate Bond.