Financial markets have continued their volatile rollercoaster ride since last month, after a very brief respite to start early June. The S&P 500, Dow Jones, and NASDAQ indices all touched new 52-week lows recently, and the S&P 500 joined the NASDAQ in Bear Market territory (which happens whenever an index falls 20% or more). Bonds have not been immune to the downward volatility as the Bloomberg US Aggregate Bond index is down nearly 12% year-to-date, and the 10-year Treasury yield reached nearly 3.5% (the highest in 11 years). We are also seeing consumer spending begin to slow, mortgage demand decrease, and corporate earnings come in below expectations. The Federal Reserve continues on their path of hiking the Fed Funds rate to combat inflation, most recently increasing rates by 0.75% which is the largest percentage since 1994.
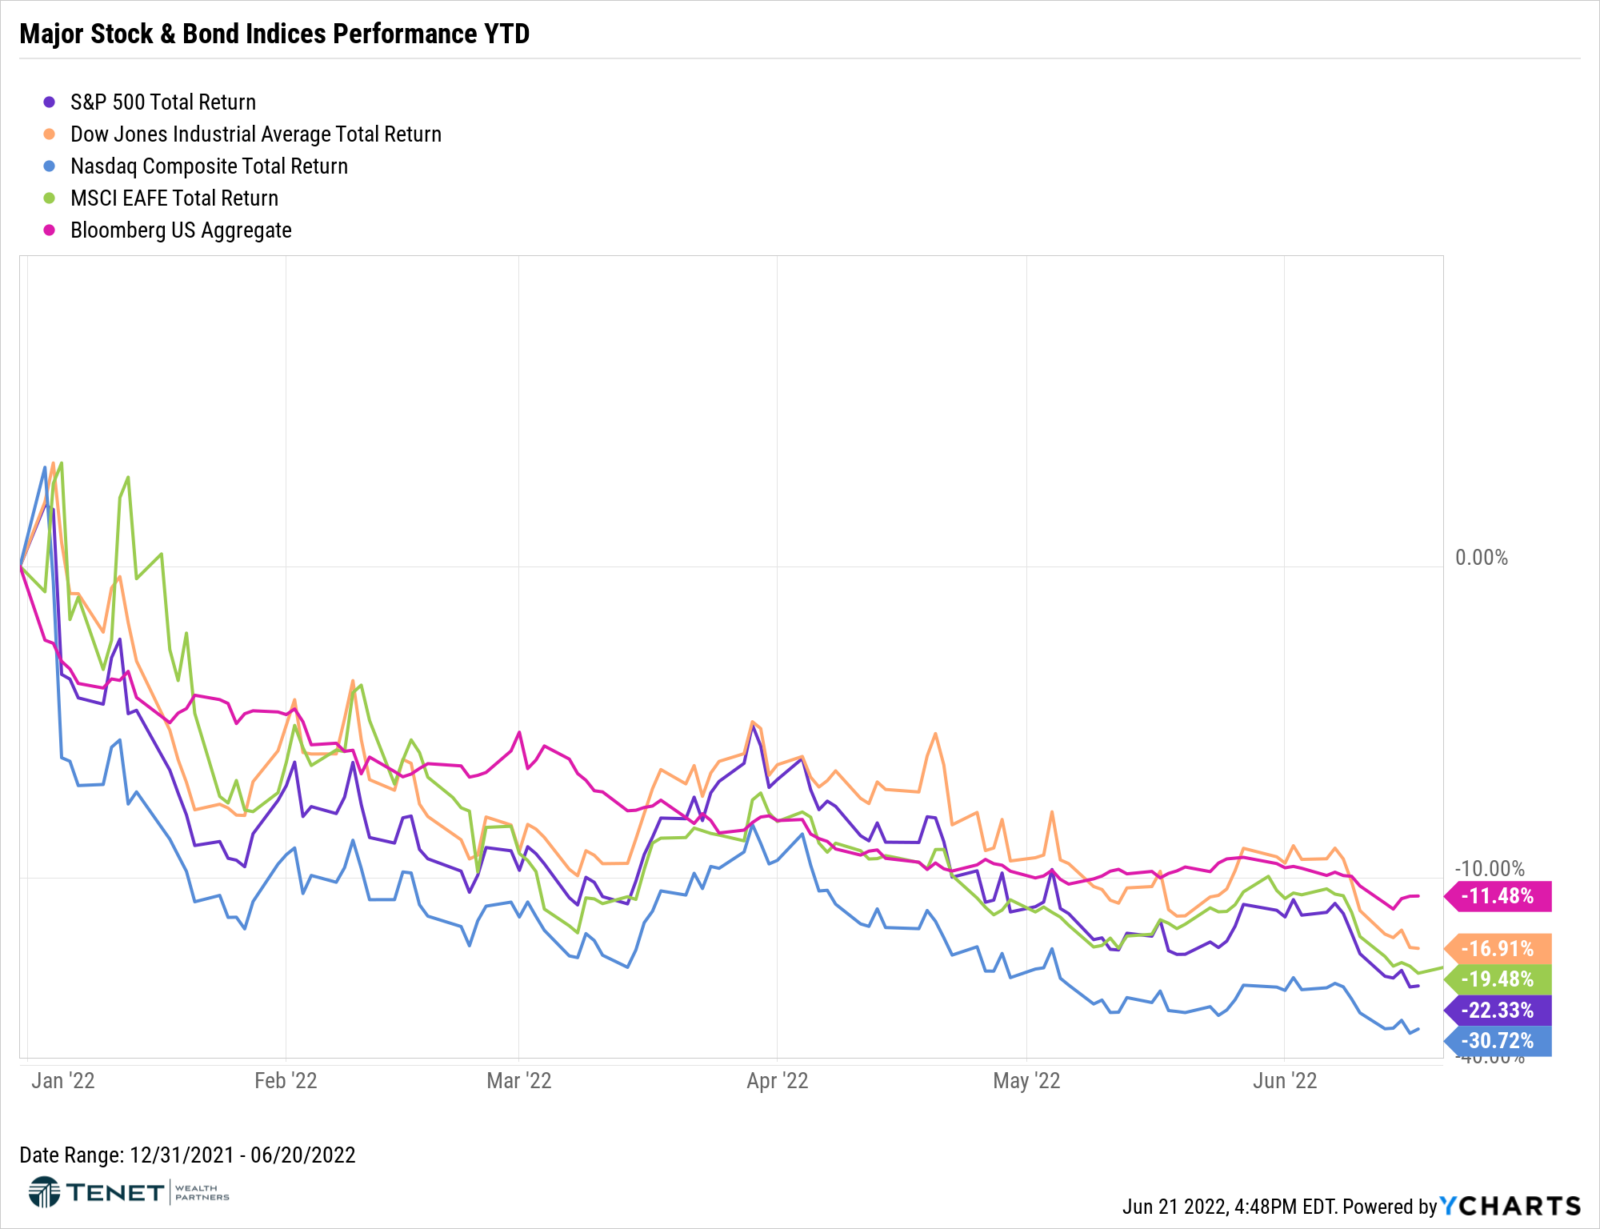
With that being said, inflation remains the dominant factor on the minds of investors, which has primarily driven the recent selloff. Last Friday’s Consumer Price Index (CPI) report for May came in higher than expected, showing an increase of 8.6% year-over-year, which is a 41-year high and higher than the expected reading of 8.3%. Core CPI (which excludes the more-volatile segments of food and energy) increased 6.0% year-over-year. Compared to April, Headline and Core CPI were up 1.0% and 0.6%, respectively. Essentially all segments of inflation continue to increase, but energy (not surprisingly) has had the most significant downward impact. Russian oil bans and supply constraints have continued to push up energy prices, and we are now seeing crude oil prices over $120/barrel which translates to higher gas prices of over $5/gallon nationally.
USD Inflation Since 1970 (Annual Rate, Bureau of Labor Statistics CPI)
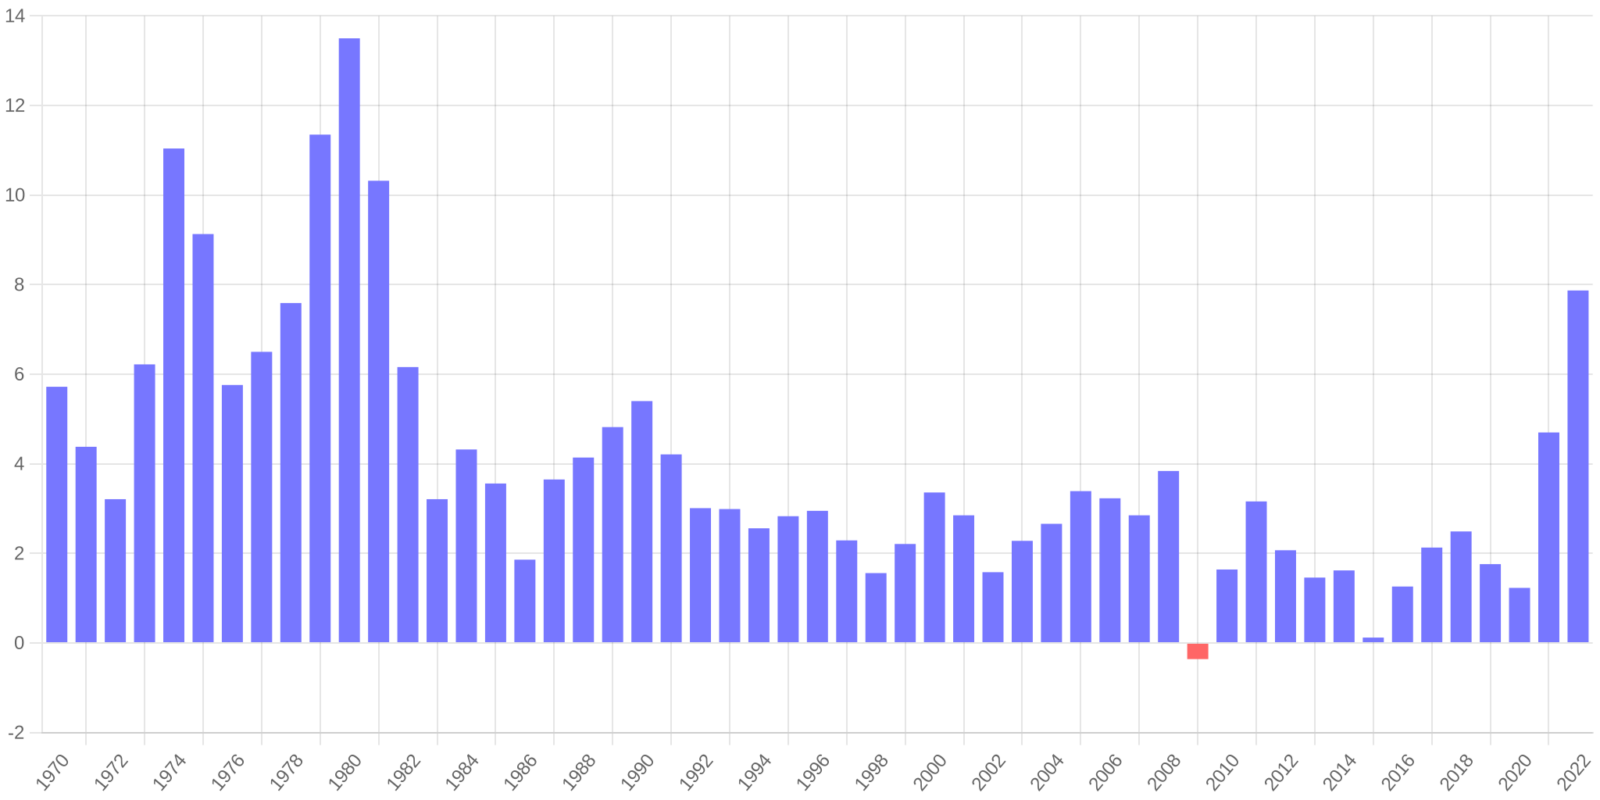
USD Inflation Since 1970 (Annual Rate, Bureau of Labor Statistics CPI)
Given that we are seeing the highest inflation readings since the ’70s and ’80s, we thought it would be interesting to take a trip back in time to compare that timeframe to what we are seeing today, while also keeping in mind what these types of current environments mean in the grand scheme of long-term investing.
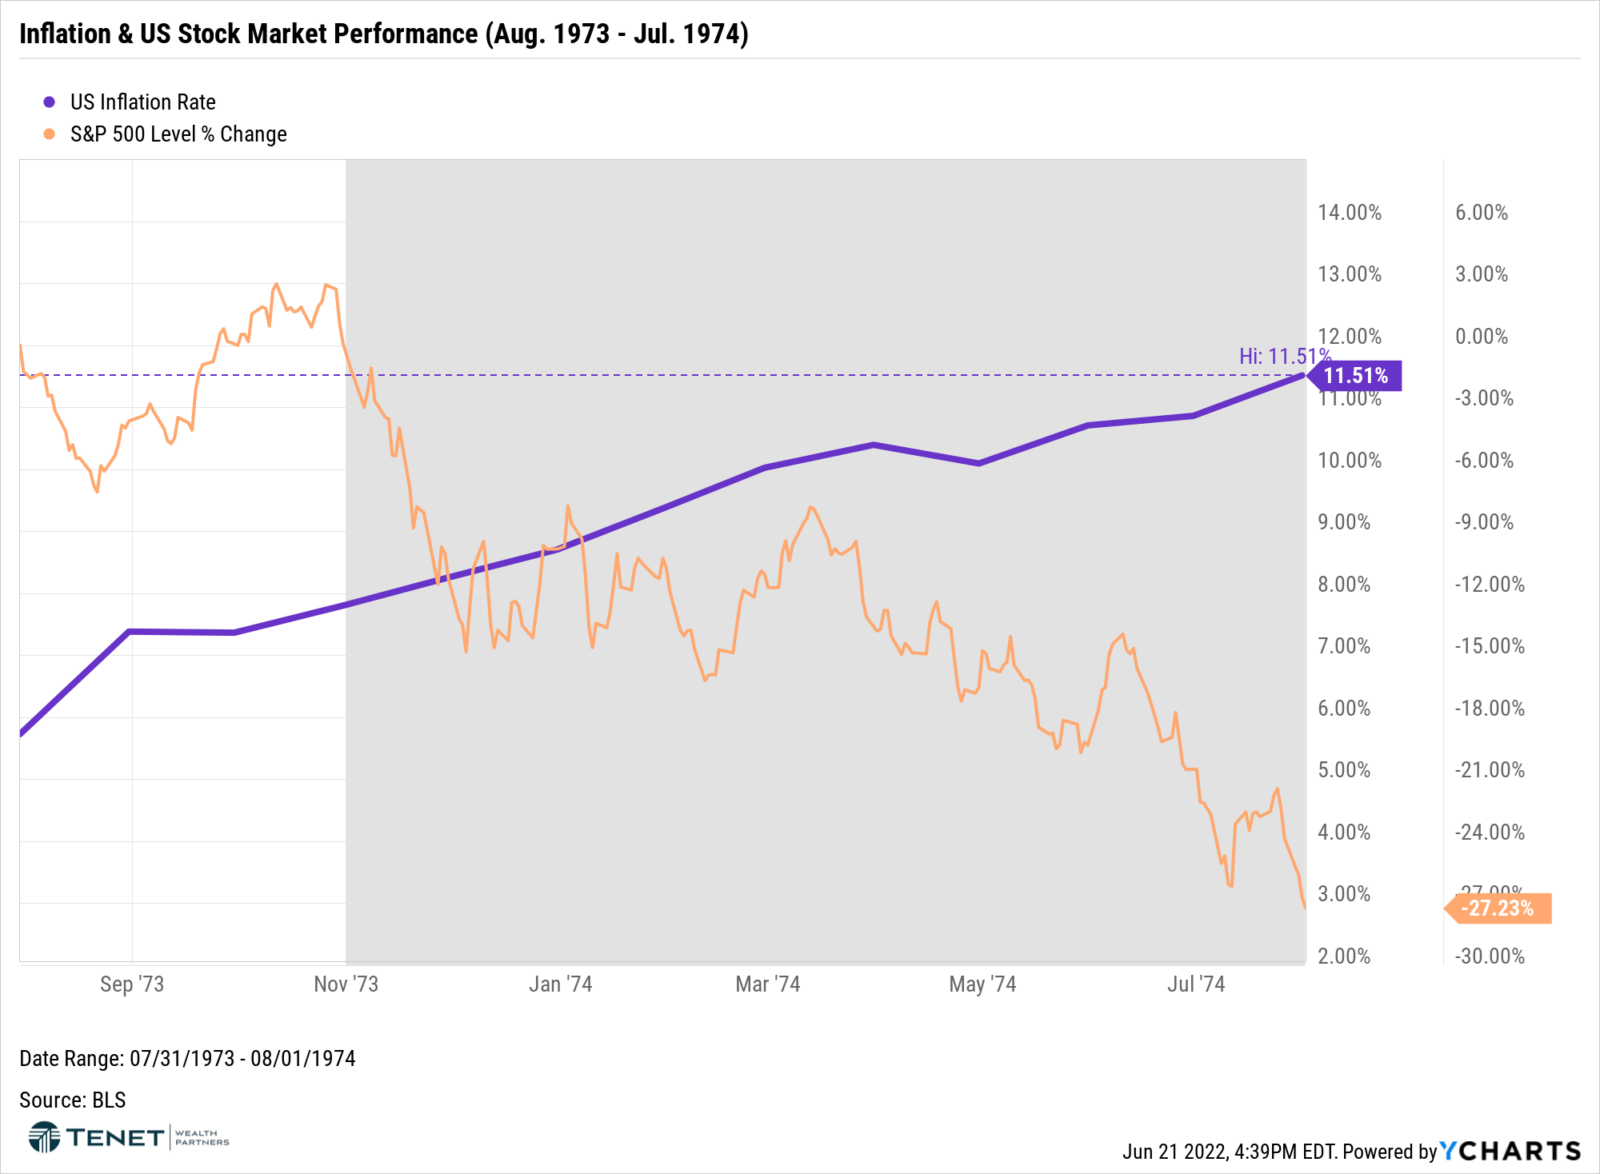
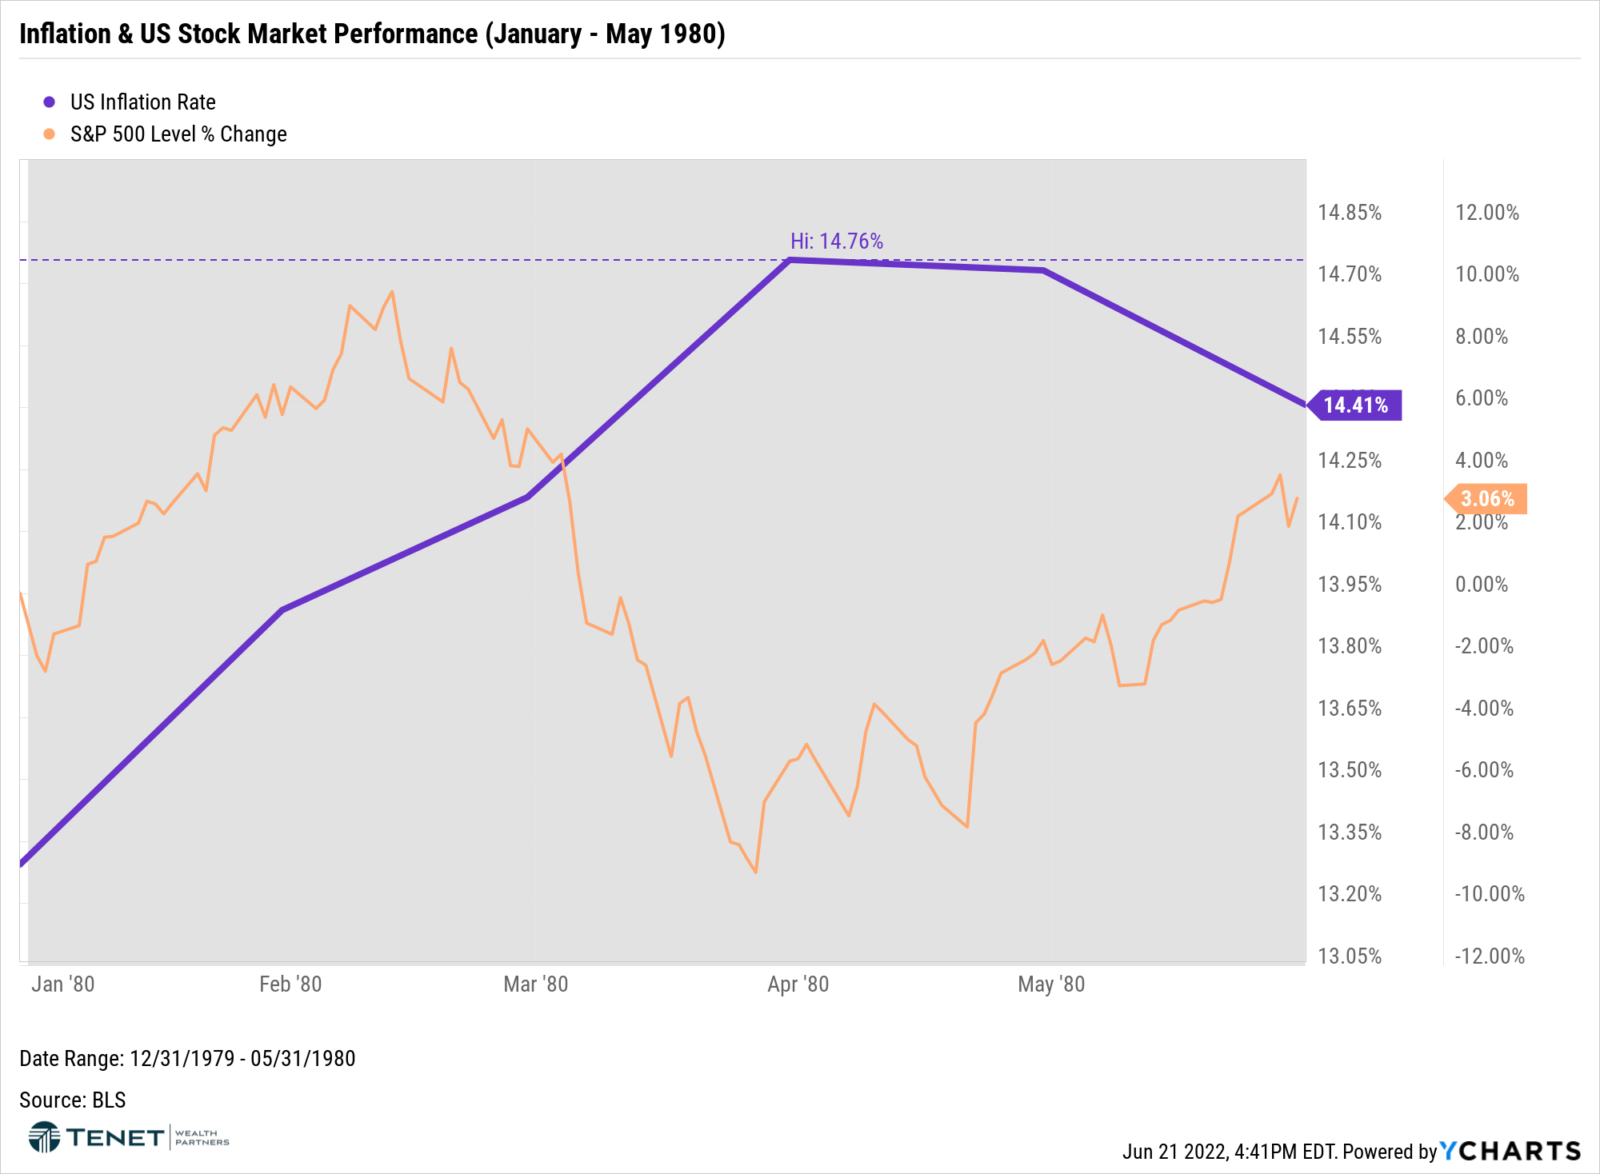
Flashback to the 70s/’80s?
It almost seems like déjà vu that we are seeing similar economic and geopolitical occurrences as we saw back in the ’70s and ’80s, such as high inflation (particularly driven by high energy prices), rising interest rates, and even tensions with Russia. The following charts show the percentage change in the S&P 500 (orange line) compared with the US CPI/inflation rate (blue line) during two periods (1) Aug. 1973 – Jul 1974, and (2) January – May 1980. We saw a volatile S&P 500 as well as inflation between 10% and 15%. We also saw recessions during these periods (as indicated by the gray areas on the chart), not to mention high interest rates and gas prices.
Looking through “two different lenses”
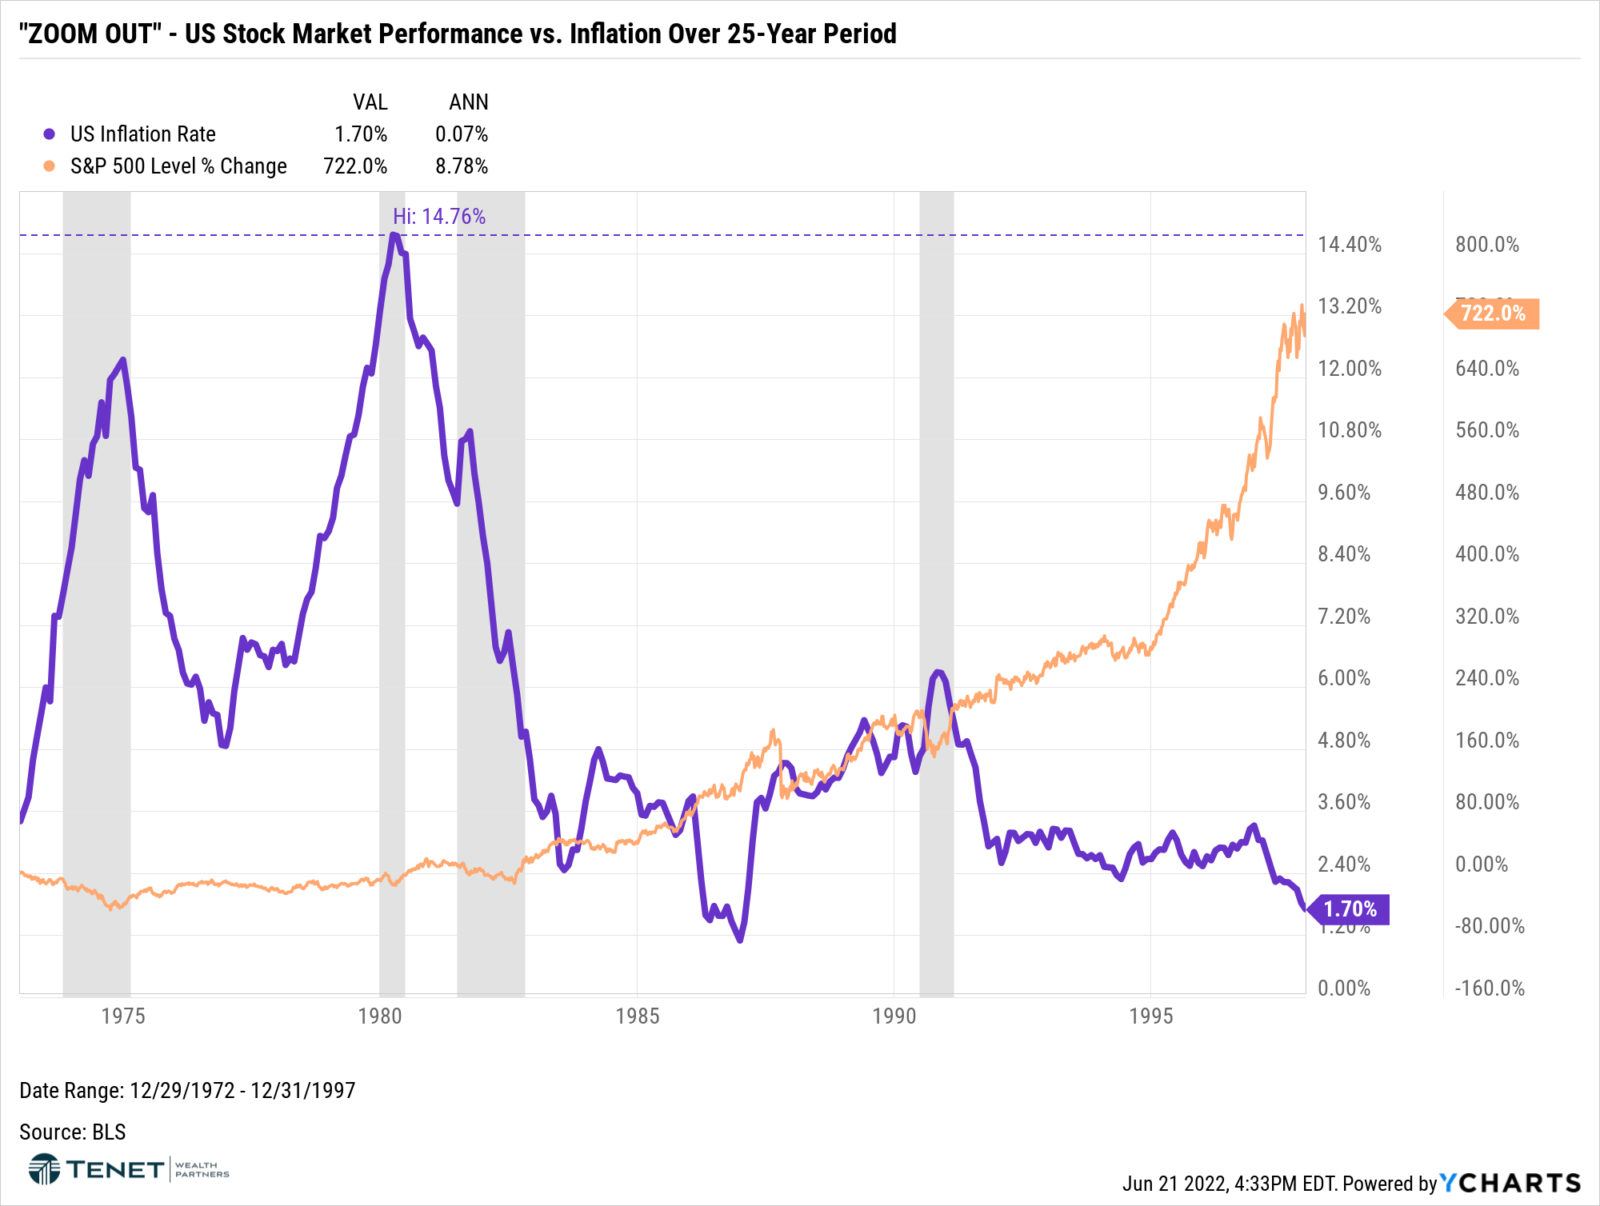
First off, let’s be clear: today is very different than the ’70s and ’80s for many reasons, and we don’t believe that the current environment is a direct comparison. The main similarity we want to focus on is the equity market volatility in a high-Inflation environment. The key aspect to keep in mind as an investor is that these periods, like today, are short-term in nature. Whenever we experience volatility like this, it Is natural to expect the worst possible outcome, especially when we “zoom in” our attention on these short-term instances. But what if we “zoom out” to view this in the context of a longer time period?
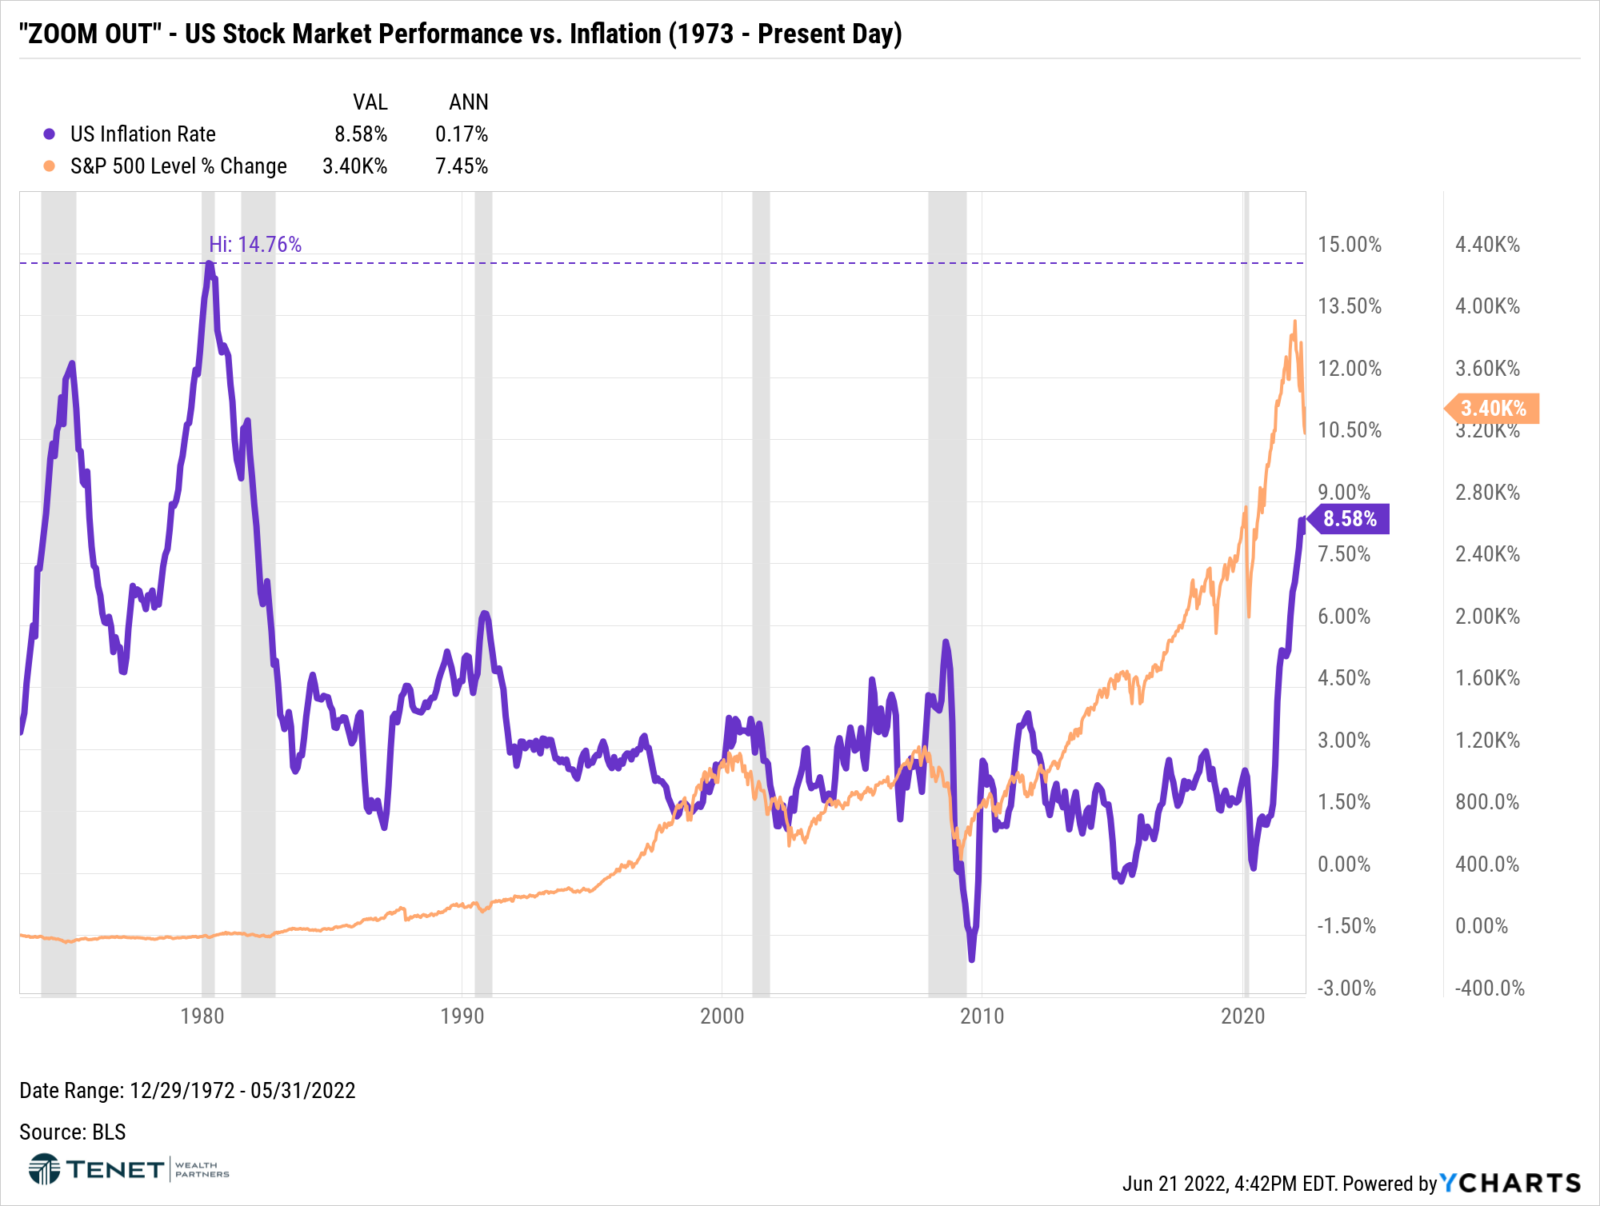
The following two charts show (1) a 25-year period from 1973 – 1998, and (2) a 50-year period from 1973 through present day. The key observation is that while we experienced not just one by multiple recessions and high inflation through both time periods, staying invested has led to 7.5-8.5% annualized returns.
Should I Stay or Should I Go?
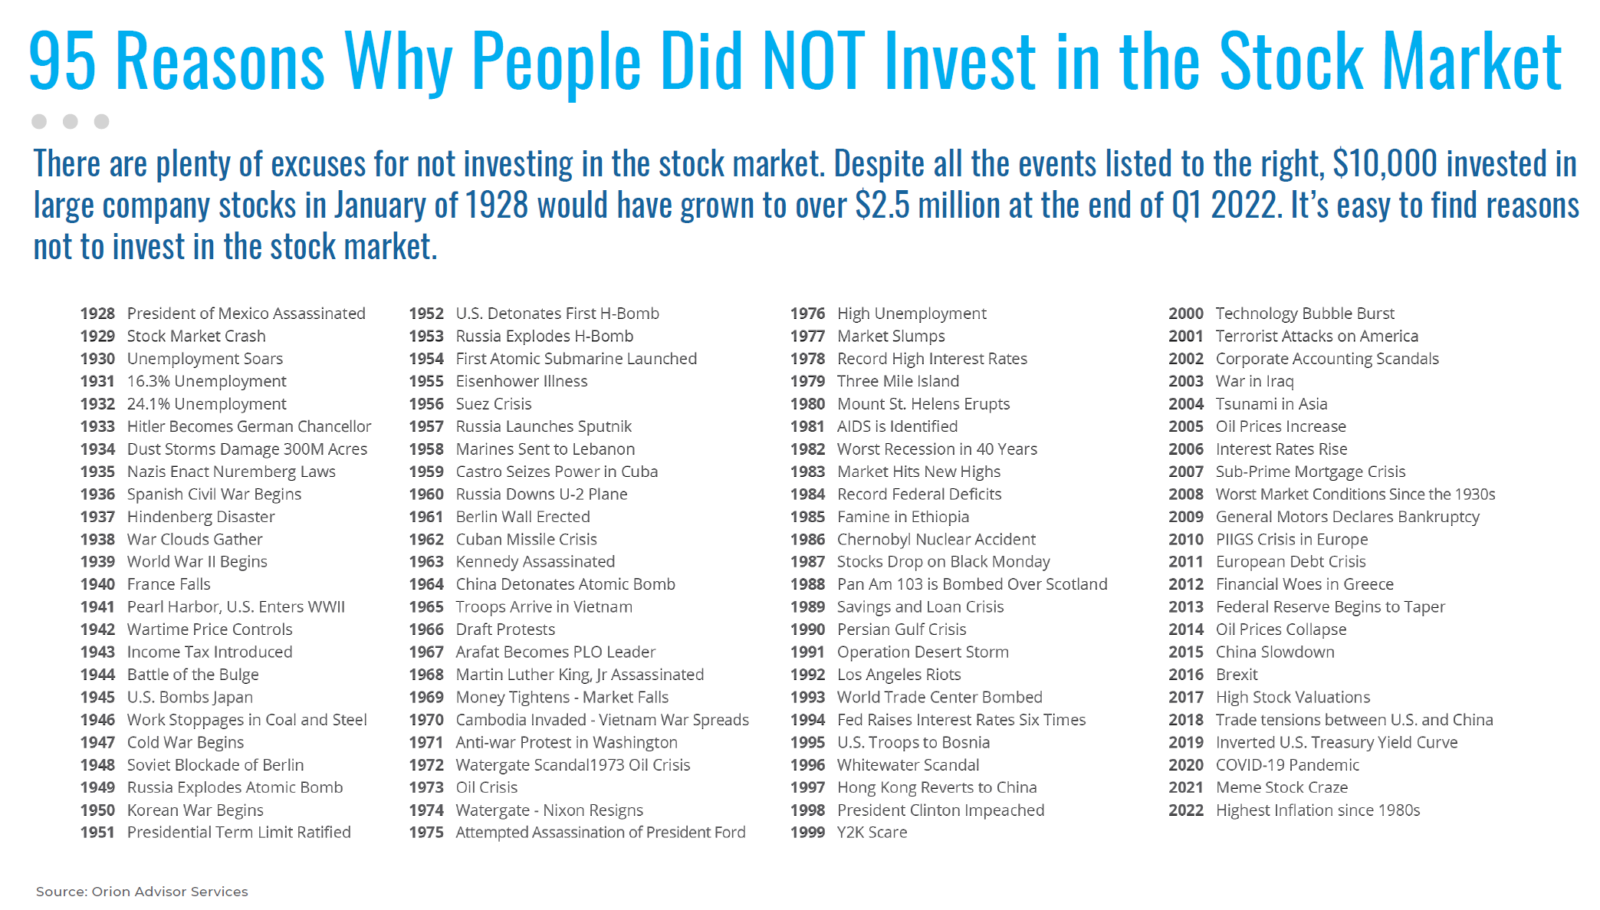
While the current environment is challenging, to say the least, we have experienced several other scenarios over the years where investors thought there was no way out or the market would never recover. Like we always say, “there Is always something going on in the market” that causes fluctuations and makes consumers question whether they should be invested or not. In fact, going back to the 1920’s, there have been 95 reasons why people did not invest in the market (see below!), yet staying invested throughout these events has led to significant long-term appreciation.
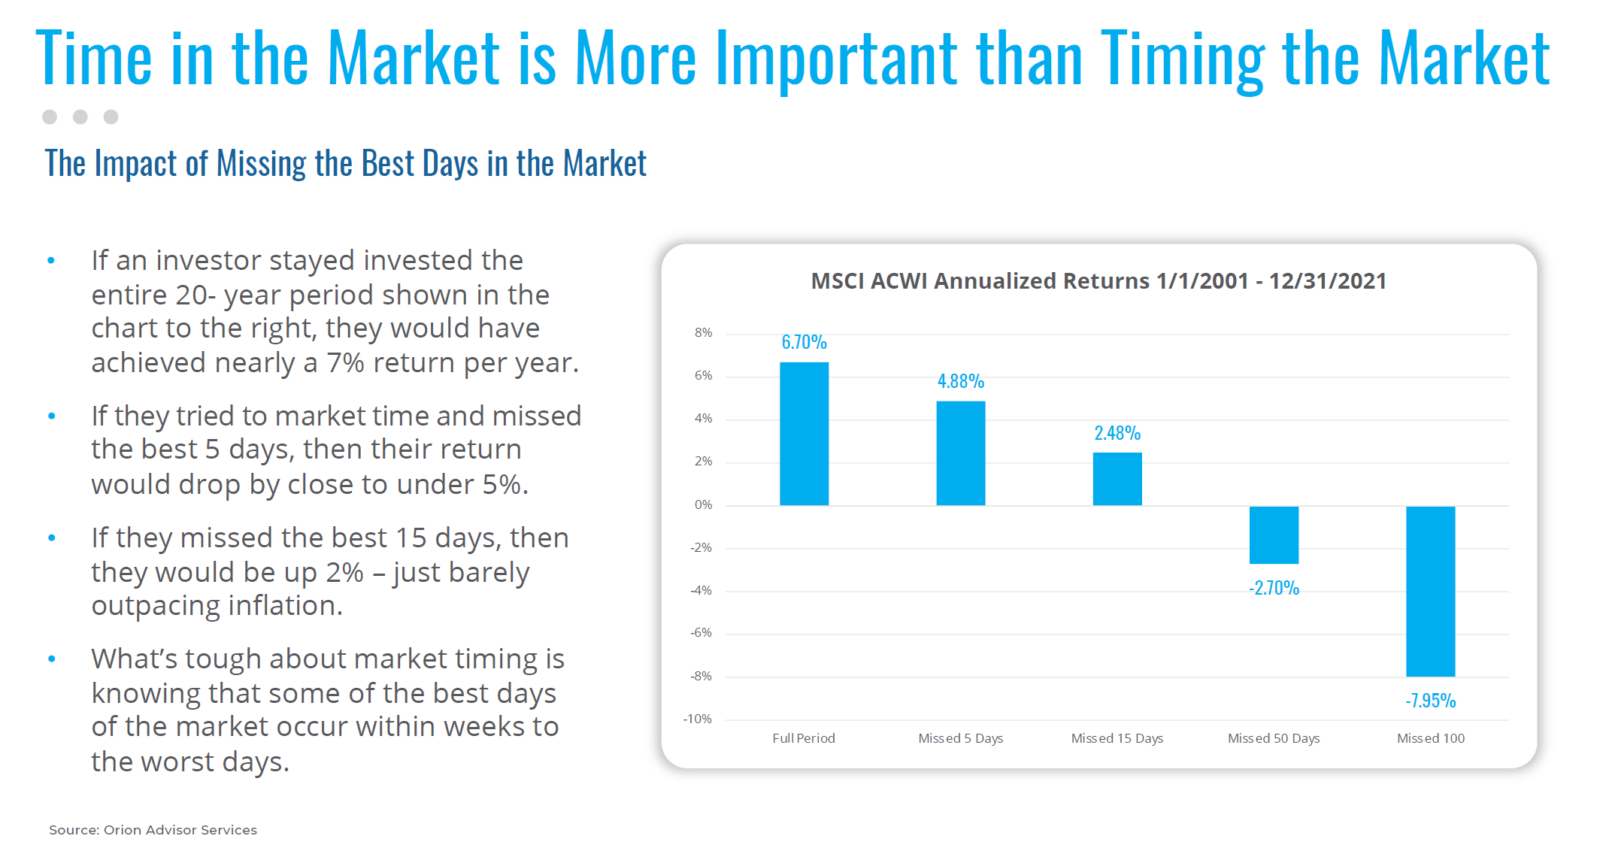
As an investor, it is also important to remember that time IN the market is more important than timing the market. It is nearly Impossible to know when the market will go up or down, and the risk of missing out on the best days of returns is greater than trying to predict the direction of returns in the short run, as evidenced below:
Inflation appears to be sticking with us for longer than expected, and it is possible that we see a recession at some point (although we believe it would be a milder version if we do). But even if that comes to pass, remember that investors have historically been rewarded for their patience and discipline, and we believe that this will be the case yet again. Of course, don’t hesitate to reach out to our team with any questions or concerns!
Sources: YCharts, Sanctuary CIO Corner, Sanctuary Wealth Chart Book May 2022, JP Morgan Asset Management, U.S. Bureau of Labor Statistics, Orion Advisor Services, CNBC, Wall Street Journal
The information provided in this communication was sourced by Tenet Wealth Partners through public information and public channels and is in no way proprietary to Tenet Wealth Partners, nor is the information provided Tenet Wealth Partner’s position, recommendation or investment advice. This material is provided for informational/educational purposes only. This material is not intended to constitute legal, tax, investment or financial advice. Investments are subject to risk, including but not limited to market and interest rate fluctuations. Any performance data represents past performance which is no guarantee of future results. Prices/yields/figures mentioned herein are as of the date noted unless indicated otherwise. All figures subject to market fluctuation and change. Additional information available upon request. The “Sample Diversified Portfolio (60/40 Allocation) is comprised of the following total return indices and allocations: 40% S&P 500, 3% S&P 400, 4% S&P 600, 15% MSCI EAFE, 5% MSCI Emerging Markets, 40% Bloomberg US Aggregate Bond.