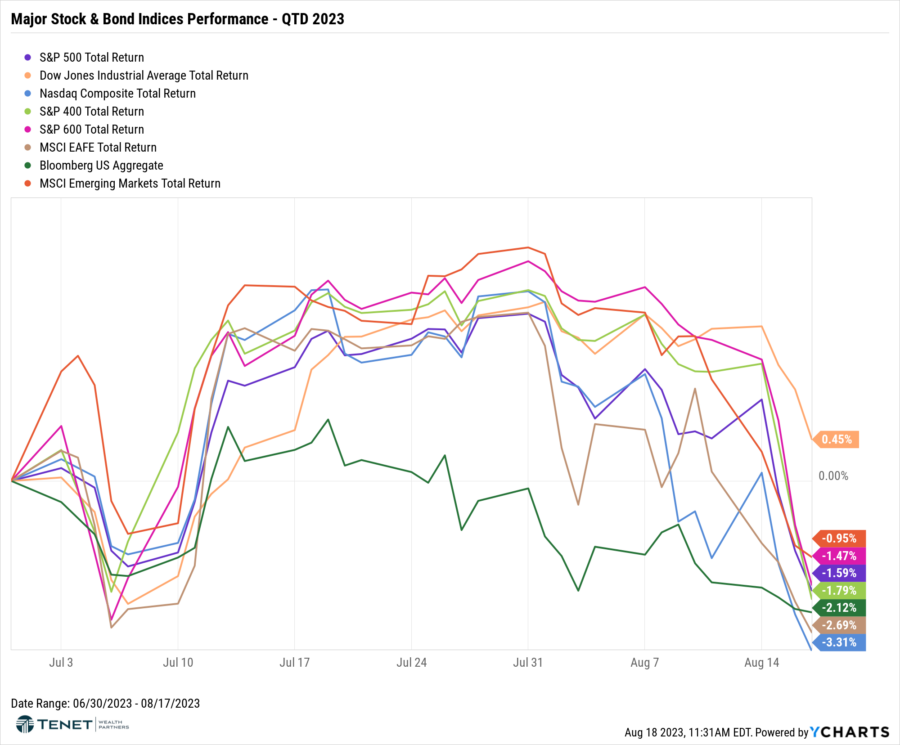
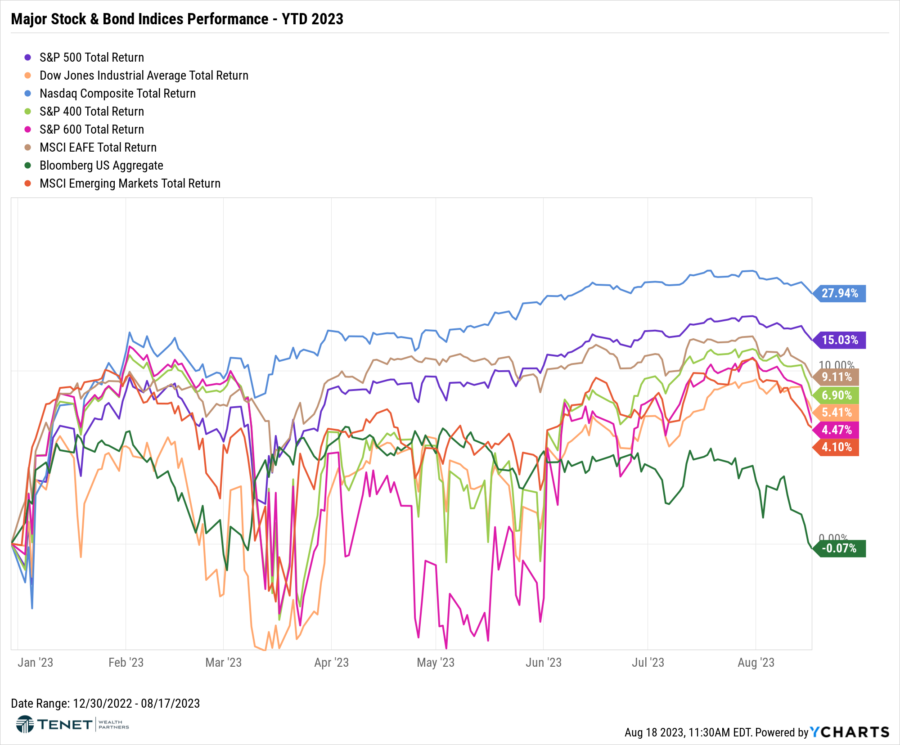
Major Index Returns – QTD & YTD 2023
Strong second quarter U.S. GDP growth, moderating inflation trends and robust earnings reports continued to support equity market performance in July. Equity returns were positive across the spectrum in July as investors raised expectations for a soft-landing for the U.S. economy. Against this backdrop, small-cap stocks (Russell 2000 Index) outperformed large-cap stocks (S&P 500 Index) for the 2nd month in a row as lower inflation and widening market strength served as a tailwind for smaller stocks. In addition, more economically sensitive and value-oriented sectors such as Energy and Materials outperformed in July and could be signaling a rotation and the potential for new market leadership.
Despite continued disinflation and recent job market strength , we have seen a pullback in equity markets for the first two weeks of August. This has mainly been driven by concerns around the recent U.S. debt downgrade by Fitch from AAA to AA+, as well as recent comments by the Federal Reserve that more interest rate hikes may be on the horizon.
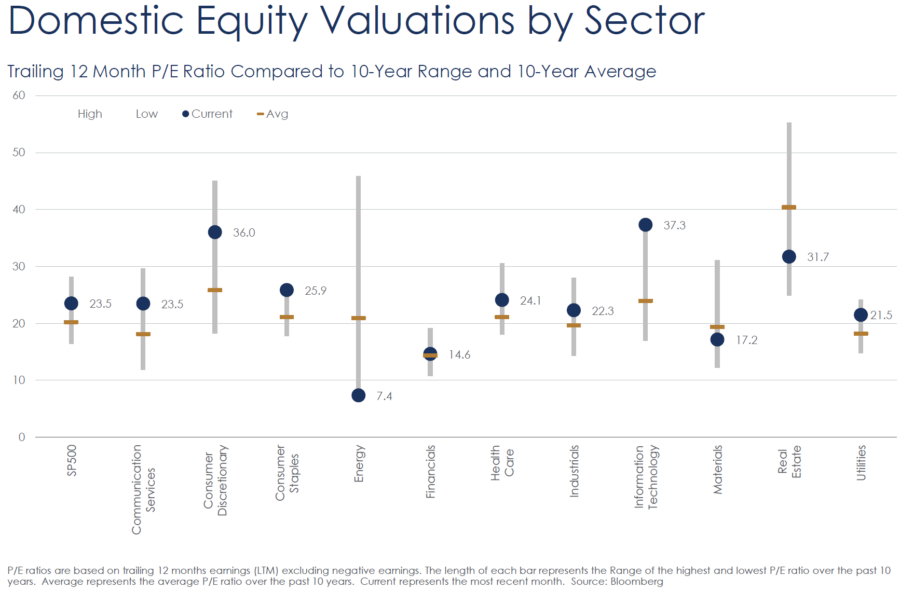
US Stock Valuations By Sector
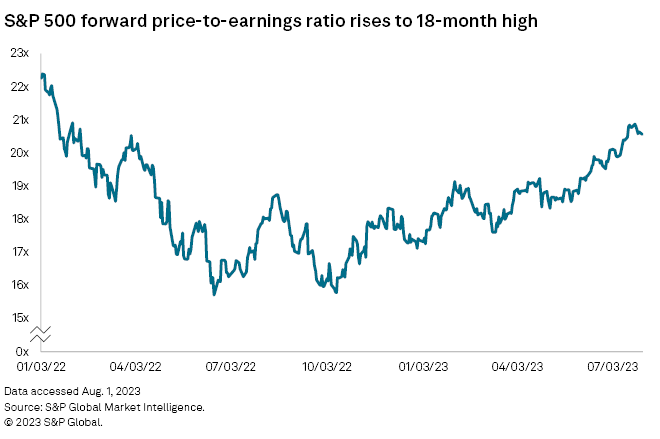
US equity valuations have climbed higher given this year’s broad rally. Stock prices are now more than 20x higher than projected earnings for the next 12 months. An increase in this valuation metric, the forward price-to-earnings (P/E) ratio, normally indicates that investors largely expect future earnings to grow. The S&P 500 forward P/E has now risen to an 18-month high.
Energy and Materials are now the only sectors with attractive valuations compared to 10-year averages, while Financials are fairly valued at this point.
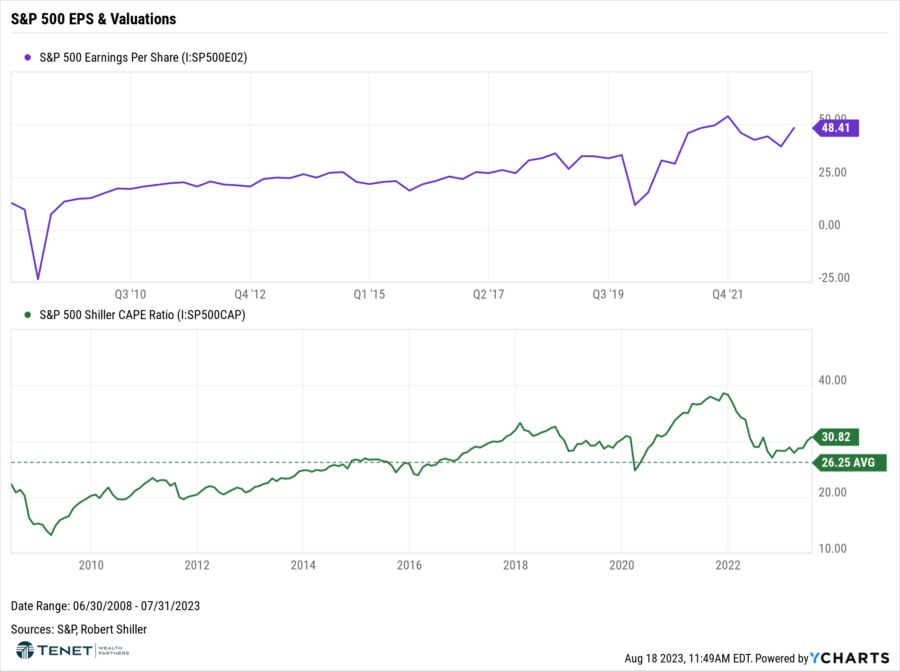
S&P 500 Corporate Earnings & Valuation
The second quarter earnings season has been mixed thus far, with most companies beating estimates yet reporting weaker-than-expected revenues. According to FactSet, of the 84% of S&P 500 companies that have reported thus far, 79% have reported a positive EPS surprise and 65% of S&P 500 companies have reported a positive revenue surprise. Additionally, the blended (year-over-year) earnings decline for the S&P 500 is -5.2%. For Q3 thus far, 49 S&P 500 companies have issued negative EPS guidance and 30 S&P 500 companies have issued positive EPS guidance.
We have also seen the widely-followed Shiller CAPE (Cyclically-Adjusted Price-to-Earnings) ratio rise higher above the historical 15-year average (now 30.82 compared with 28.81 as of 5/31). While climbing stock prices have bumped up valuations, we have also seen EPS grow to the current level of 48.41, up from 39.61 last quarter and up from 45.99 one year ago.
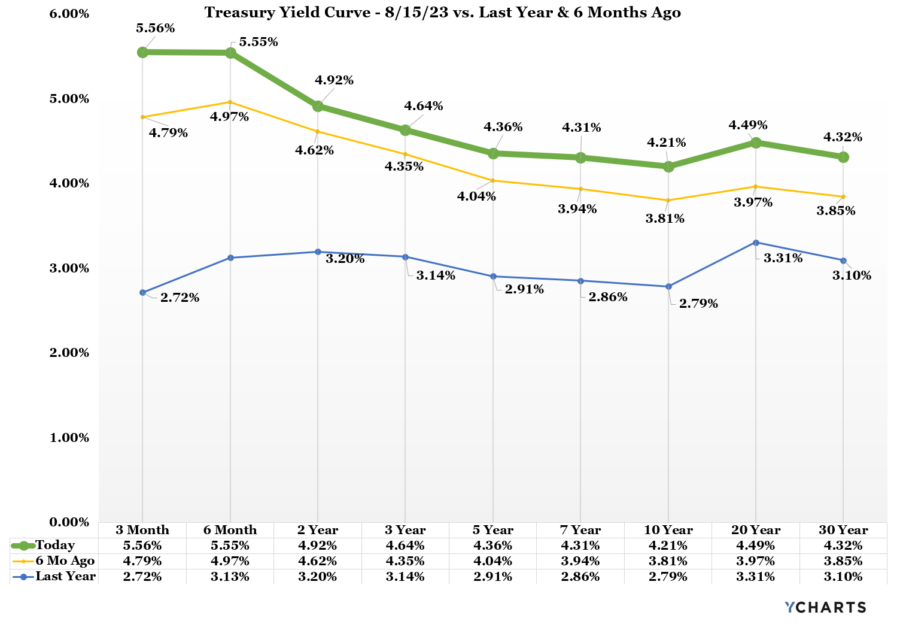
Bond Market & Yields
Both the U.S. Fed and European Central Bank (ECB) raised policy rates 0.25% in July. The offsetting impacts of tightening monetary policy vs. strong investor risk appetite may create opportunities across fixed income markets. Return opportunities in high-quality bonds have improved meaningfully, with yields around 5%, and price headwinds may start to fade as central banks contemplate pausing rate hikes. Corporations and municipalities generally have strong credit fundamentals but face ongoing headwinds from high borrowing costs.
We also continue to see an inverted yield curve, meaning the 2-year Treasury yield is above the 10-year Treasury yield. As mentioned in prior commentaries, an inverted yield curve has historically predicted coming recessions with impressive accuracy. However, most major economic data points continue to point to a strong (and very resilient) economy. Moreover, yields on long-term US Treasuries have increased to their highest level since 2007, indicating that investors are becoming more confident that the Federal Reserve would be successful in preventing a recession while curbing inflation via their rate hikes.
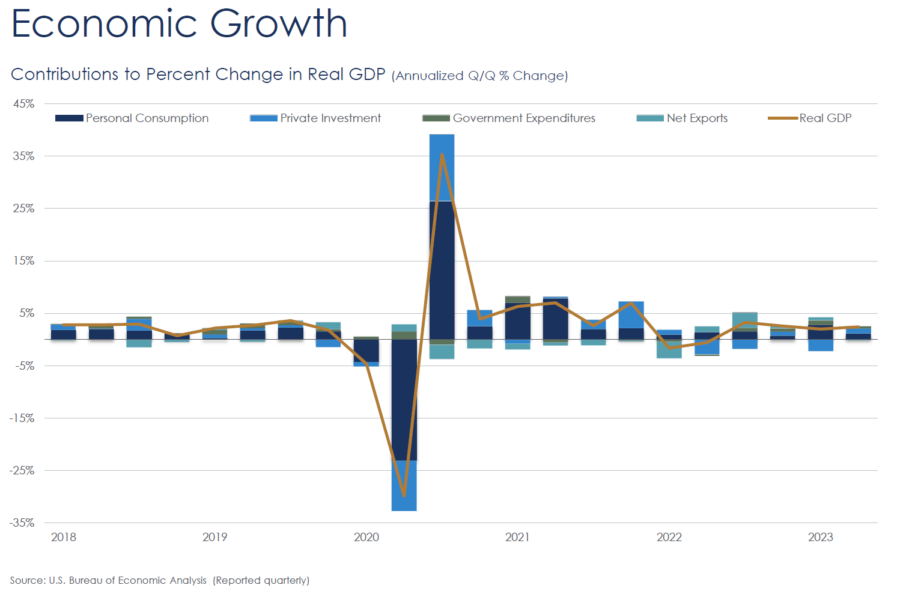
Economic Growth
According to the Commerce Department, U.S. gross domestic product grew at an annualized rate of 2.4% during Q2, well above the consensus estimate of 1.8%. Increases in consumer spending and nonresidential fixed investment, which includes spending on commercial real estate and equipment, led the growth of the economy in Q2. The economy withstood pressures from recession fears, higher interest rates, the Fed’s hawkish policy tilt, and tighter bank lending standards. However, we may see slowing growth in the coming quarters as tighter lending standards and elevated interest rates take their toll.
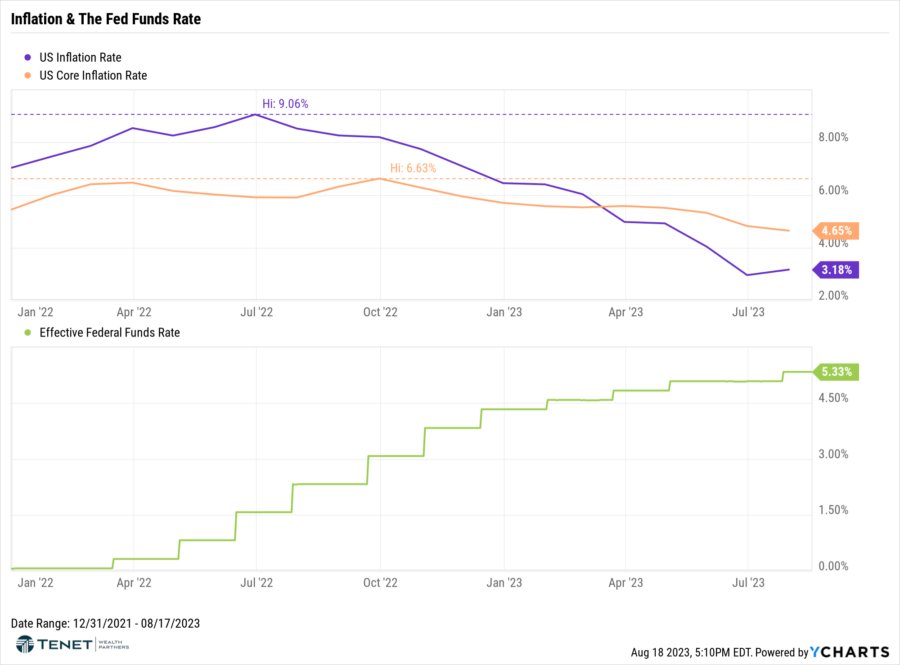
Inflation Outlook
The latest consumer price index (CPI) figures increased 3% year-over-year. Even though inflation has continued to go down, price increases remain higher than the Fed’s 2% annual target rate. As has been the case for the last year, the drop in inflation can largely be attributed to a 17% decline in energy prices. Core inflation, ex food and energy, has consistently hovered above CPI and came in at 4.8% in June. This was the lowest core inflation rate since 2021, a sign that overall prices are cooling. Housing prices remain a big driver of both core inflation and core PCE, with housing prices rising 7.8% over the last year.
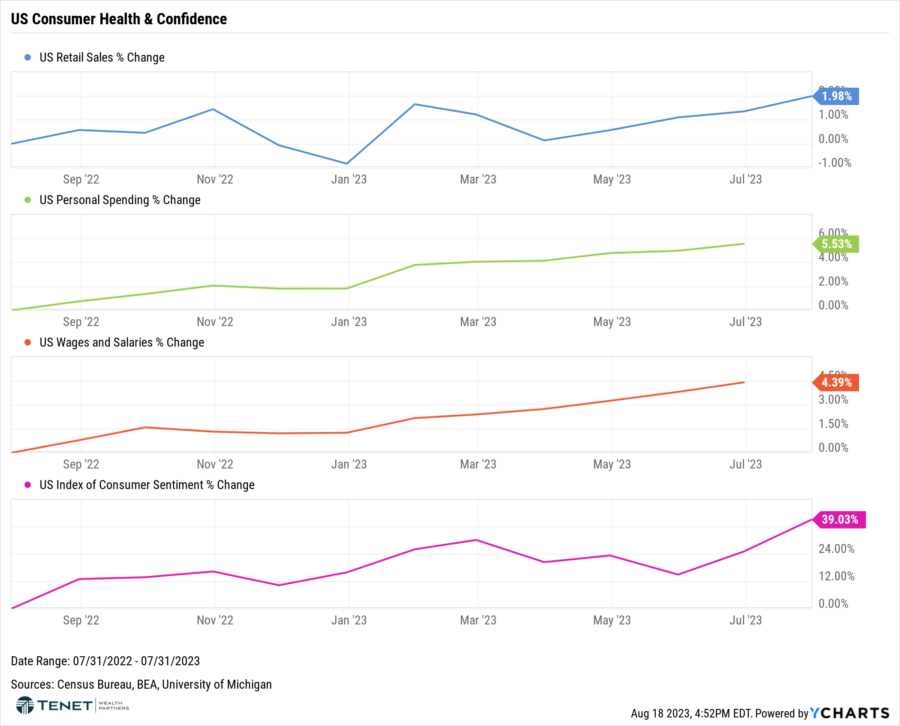
Consumer Health & Outlook
As reported by the Conference Board, consumer confidence rose in July to its highest level since July 2021. Greater confidence was evident across all age groups, and among both consumers earning incomes less than $50,000 and those making more than $100,000. Consumer assessments of the present situation rose in July on brighter views of employment conditions. This likely reflects upbeat feelings about a labor market that continues to outperform. When asked about current family financial conditions, the share of respondents citing a ‘good’ situation rose, and those citing ‘bad’ conditions fell, signaling still-healthy family finances.
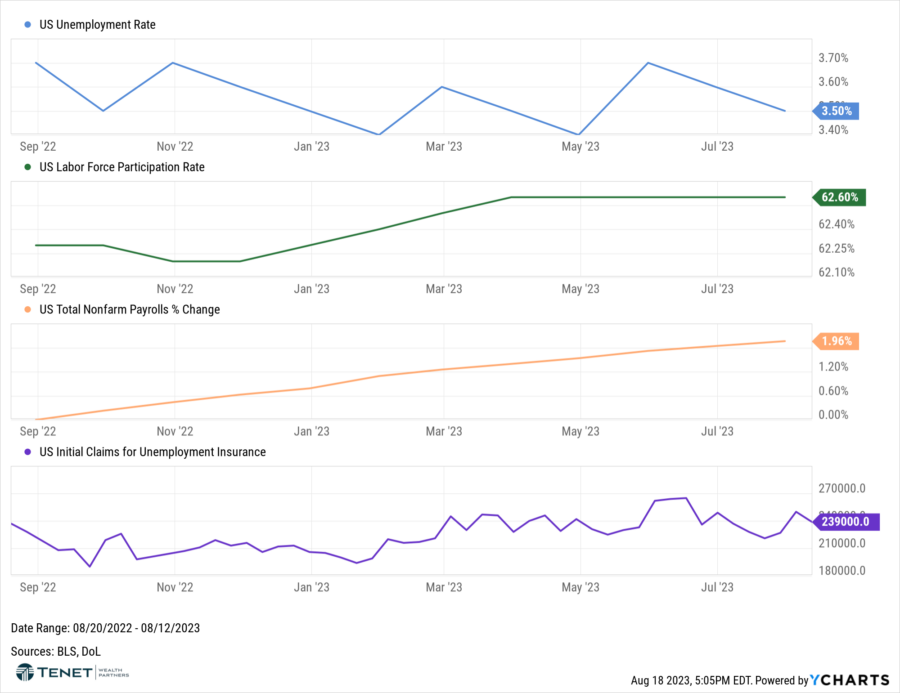
Job Market Outlook
The U.S. economy added fewer jobs than expected in July, but solid wage gains and a decline in the unemployment rate back to 3.5% pointed to continued tightness in labor market conditions. The Labor Department’s employment report also showed job gains in May and June were revised lower, potentially suggesting demand for labor was slowing in the wake of the Federal Reserve’s interest rate hikes. But with 1.6 job openings for every unemployed person in June, the moderation in hiring may also be the result of companies failing to find qualified workers.
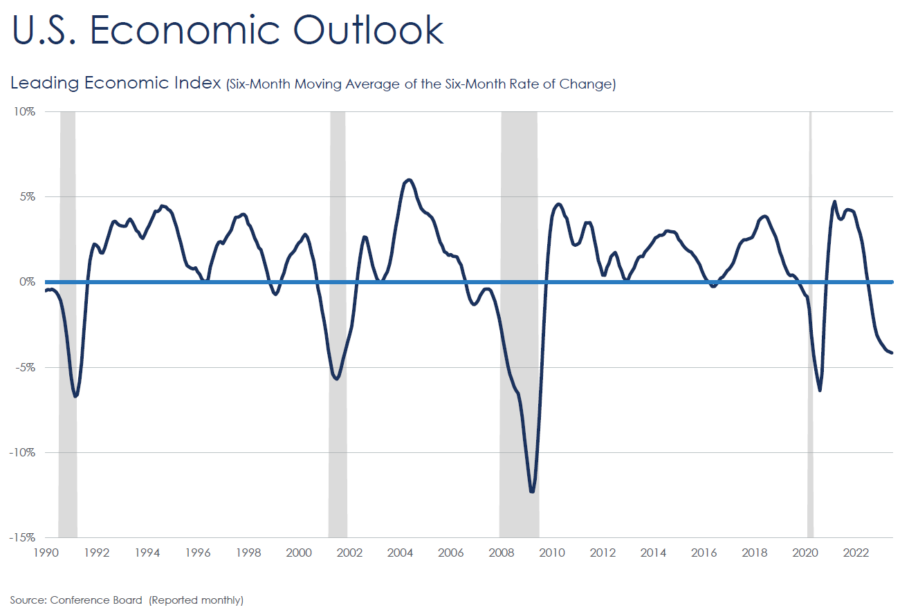
US Economic Outlook
According to the Conference Board, the U.S. Leading Economic Index (LEI) fell again in June, fueled by gloomier consumer expectations, weaker new orders, an increased number of initial claims for unemployment, and a reduction in housing construction. The Leading Index has been in decline for fifteen months. The Conference Board still forecasts that the U.S. economy may enter a recession prior to the end of 2023, given elevated prices, tighter monetary policy and tighter credit standards. However, a resilient consumer, strong labor market, and better-than-expected corporate earnings indicate otherwise.
Registered Representative of Sanctuary Securities Inc. and Investment Advisor Representative of Sanctuary Advisors, LLC. Securities offered through Sanctuary Securities, Inc., Member FINRA, SIPC. Advisory services offered through Sanctuary Advisors, LLC., a SEC Registered Investment Advisor. Tenet Wealth Partners is a DBA of Sanctuary Securities, Inc. and Sanctuary Advisors, LLC.

The information provided in this communication was sourced by Tenet Wealth Partners through public information and public channels and is in no way proprietary to Tenet Wealth Partners, nor is the information provided Tenet Wealth Partner’s position, recommendation or investment advice. Tenet makes no representations as to the accuracy and completeness of information provided herein. Any investment discussed may not be suitable for all investors. Investors must make their own decisions based on their specific investment objectives and financial circumstances. Additional information available upon request.
This material is provided for informational/educational purposes only. This material is not intended to constitute legal, tax, investment or financial advice. Investments are subject to risk, including but not limited to market and interest rate fluctuations. Any performance data represents past performance which is no guarantee of future results. Prices/yields/figures mentioned herein are as of the date noted unless indicated otherwise. All figures subject to market fluctuation and change. Additional information available upon request.
About The Author
Kevan Melchiorre, CFP®Co-Founder & Managing Partner
Kevan Melchiorre co-founded Tenet Wealth Partners in 2021 with a focus on delivering a premier client experience, supported by an innovative and fully integrated approach to wealth planning. As a CERTIFIED FINANCIAL PLANNER™ practitioner with over 15 years of wealth management experience, Kevan partners with affluent individuals, families, and institutions to help align their capital […]
Learn more about Kevan