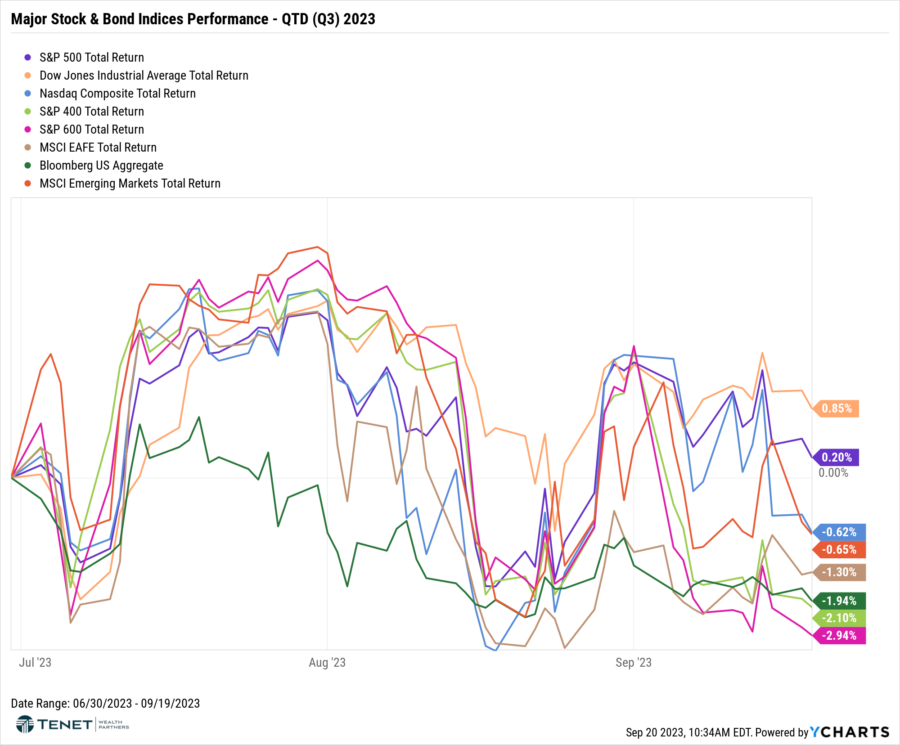
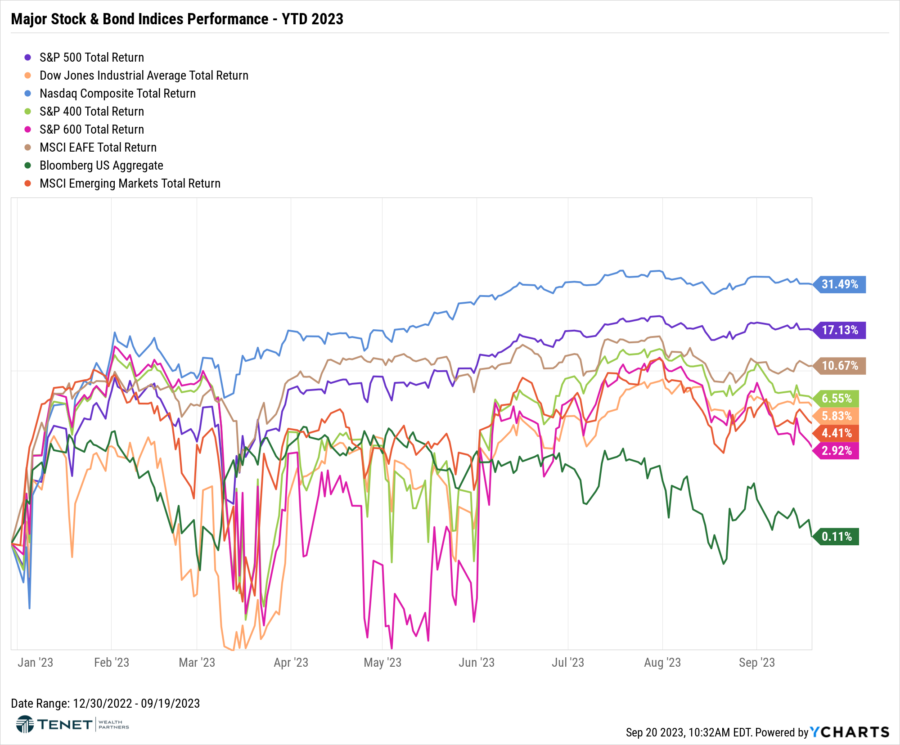
Major Index Returns – QTD & YTD 2023
Global equities ended August in the red as markets were unable to look past weaker-than-anticipated economic data in China, pulling global benchmarks lower for the month. The S&P 500 Index fell 1.6% in August; during the same period, non-U.S. markets were further challenged by a stronger U.S. dollar with the MSCI EAFE Index and MSCI Emerging Markets Index losing 3.8% and 5.5%, respectively. During the month, investors preferred the safety of large cap stocks relative to small cap stocks which have greater exposure to underperforming regional banks.
Thus far in September, equity markets have digested a slew of mixed economic data points, leading to slightly negative performance. Consumer spending and retail sales reports came in better than expected through August, although the personal savings rate continues its decline. U.S. job growth also slowed sharply in August, and we also saw the unemployment rate jump to its highest level (3.8%) since January 2022. However, the most notable and impactful report was related to inflation, with the August CPI showing its biggest monthly gain of 2023. One bright spot for the stock market was the recently successful IPO of ARM Holdings on 9/14, a semiconductor chip designer based in the UK. This was the largest IPO of the year and showed signs of life in a recently dormant IPO market overall.
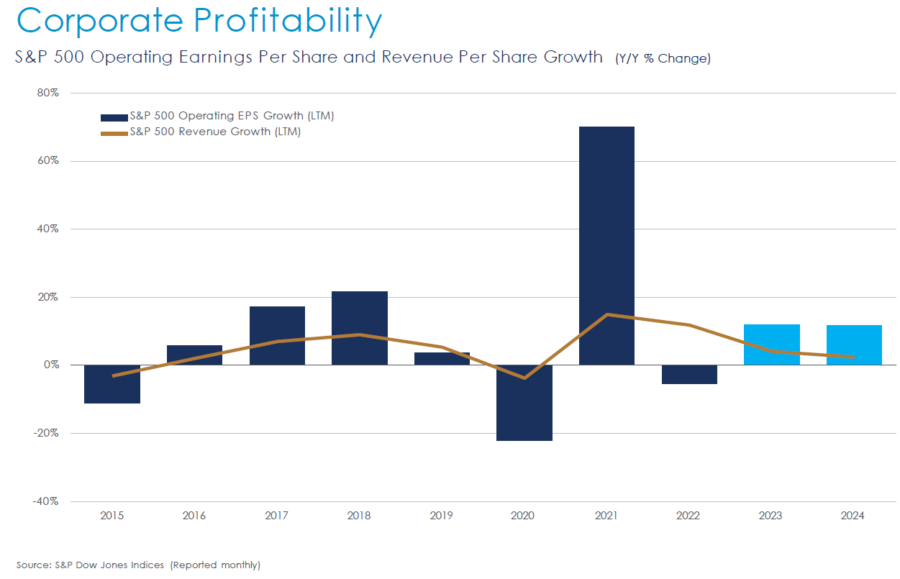
Corporate Profitability
According to FactSet, 116 companies in the index have issued EPS guidance for Q3 2023 (as of 9/15/23). Of these 116 companies, 64% (74 out of 116) have issued negative EPS guidance, which is above the 5-year average of 59% but equal to the 10-year average of 64%.
However, on a positive note, the estimated (year-over-year) Q3 earnings growth rate for the S&P 500 is 0.2%. If this is the actual growth rate for the quarter, it will mark the first quarter of year-over-year earnings growth since Q3 2022. Additionally, during the months of July and August, analysts increased EPS estimates for S&P 500 companies for the third quarter. The Q3 bottom-up EPS estimate increased by 0.4% (to $56.10 from $55.86) from June 30 to August 31, which is another welcome sign from a corporate profitability perspective.
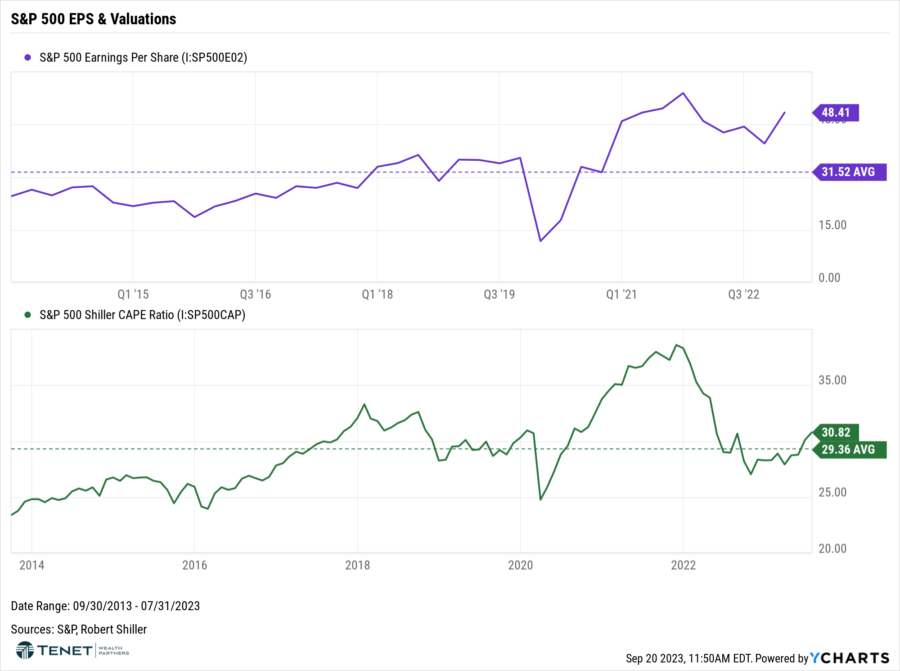
US Stock Valuations
Looking at stock valuations, we have certainly seen a recent climb in valuations since the start of 2023 as a result of the boost in equity prices. However, when compared to the 10-year average, the current S&P 500 Shiller CAPE ratio is only slightly higher than the average (30.82 vs. 29.36 average) while EPS is significantly higher (48.41 vs. 31.52 average). This is a positive sign for investors worried that the market is overpriced and expensive.
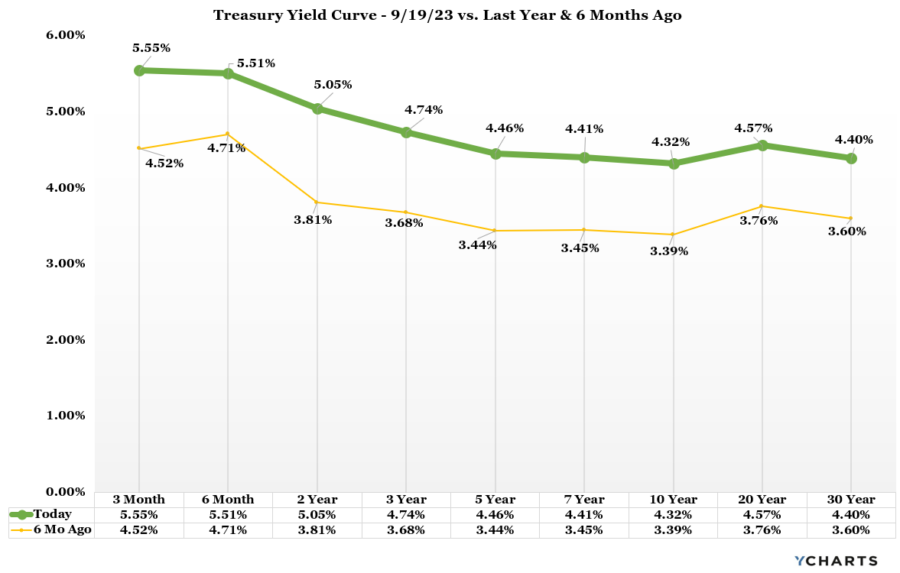
Bond Market & Yields
Global bonds ended August in the red as concerns around economic growth in China and upward pressure on interest rates weighed on returns. August started off on uncertain footing as Fitch Ratings downgraded the sovereign credit rating of the U.S. to AA+ from AAA, and the Bank of Japan unexpectedly adjusted its policy on how it manages the yield curve. Negative investor sentiment from these developments was counterbalanced with better-than-expected data in the U.S., underscoring a still-resilient labor market and moderating inflation pressures. Higher interest rates also dampened investor sentiment, with U.S. rates trending higher over the last month.
The 10-year Treasury saw an increase from 4.18% at the start of September to 4.32% as investors awaited the Fed’s decision on rates. The “Hawkish Hold” that many expected from the Fed came to fruition as they announced that they would leave interest rates unchanged for September; however, they signaled that rates may stay higher for longer while also hinting at one more rate hike this year before ending its hiking campaign.
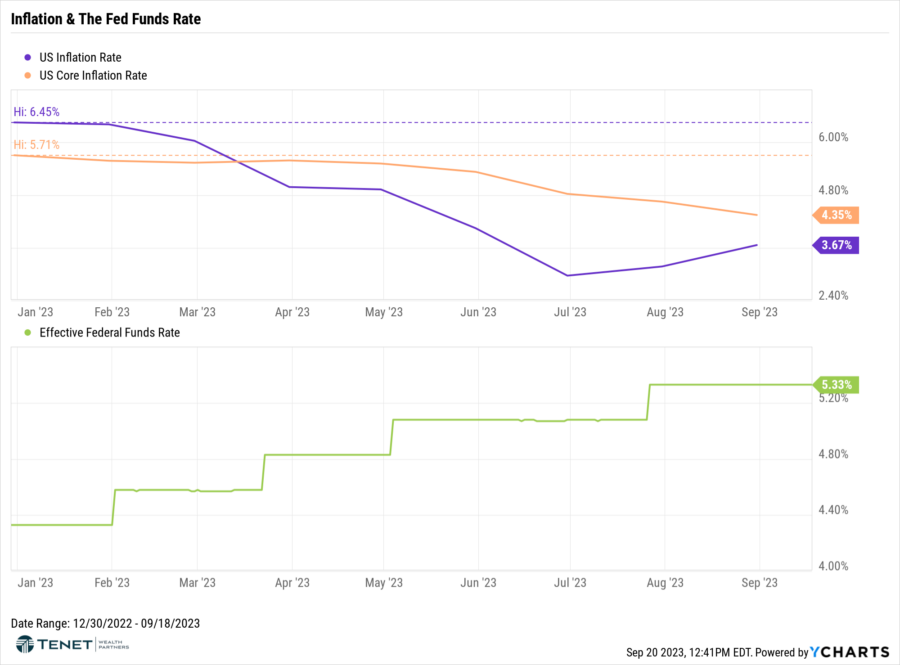
Inflation Outlook
The August inflation report showed the largest monthly increase of the year, mainly driven by higher energy prices. The Consumer Price Index (CPI) rose a seasonally adjusted 0.6% for the month and was up 3.7% from a year ago. Core CPI, which excludes volatile food and energy and is the more preferred inflation gauge by the Federal Reserve, increased 0.3% and 4.3%, respectively, compared to estimates of 0.2% and 4.3%.
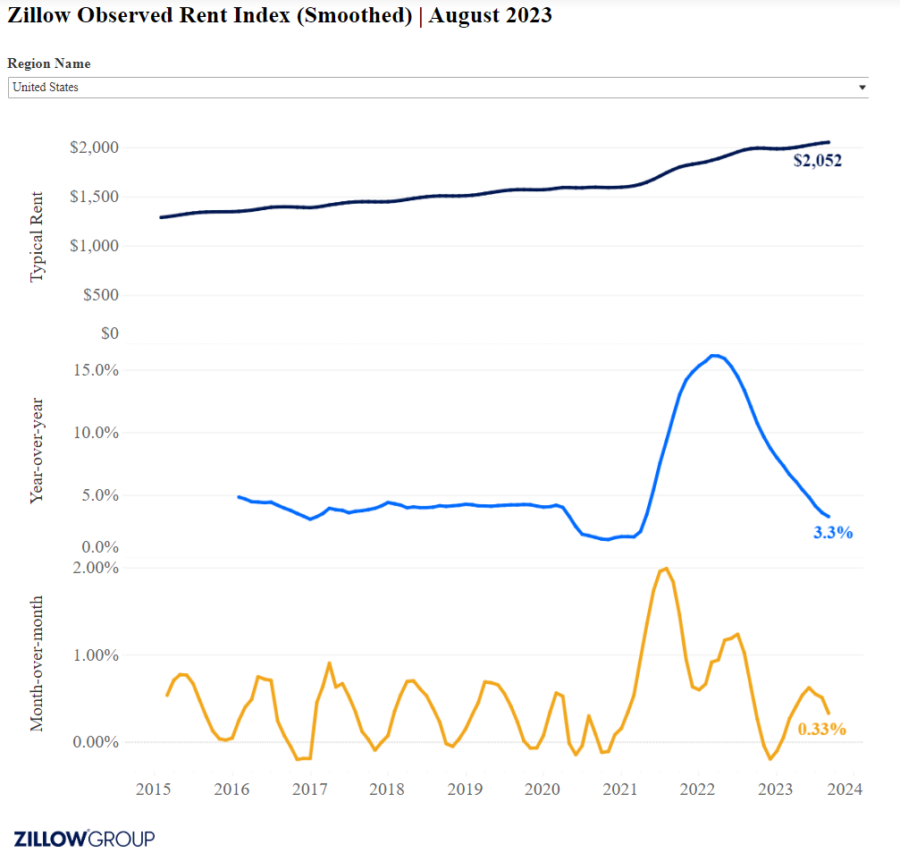
Beyond energy prices, food prices rose 0.2% and airfares jumped 4.9%. Shelter costs, which make up about one-third of the CPI weighting, are still proving to be one of the stickiest parts of inflation with an increase of 0.3%. Housing continues to have an outsized impact on inflation, even with rent growth falling sizably over the last year. According to Zillow, the monthly growth rate of the Rent of Primary Residence has dropped to an annualized pace of 4.98%, which should help pull down the true annual growth rate if this pace holds. Moreover, we experienced especially hot CPI rent readings for the first half of 2022, so the year-over-year comparisons should look ever more favorable in the coming months.
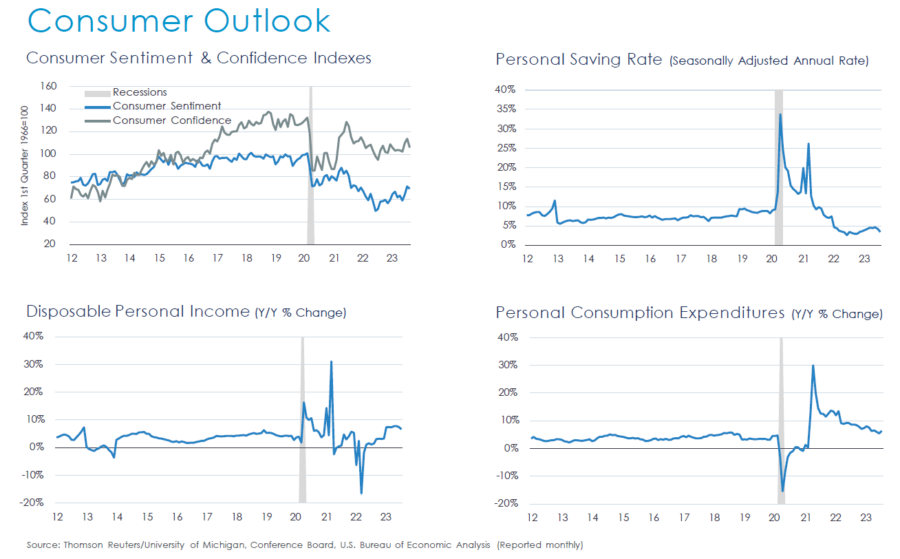
Consumer Health & Outlook
As reported by the Conference Board, consumer confidence fell in August, erasing back-to-back increases in June and July. August’s disappointing headline number reflected dips in both the current conditions and expectations indexes. Write-in responses showed that consumers were once again preoccupied with rising prices in general, and for groceries and gasoline in particular. The pullback in consumer confidence was evident across all age groups. Hard data confirm that employment gains have slowed, overall wage increases are less generous compared to a year ago, and the average number of weeks of unemployment is ticking upward.
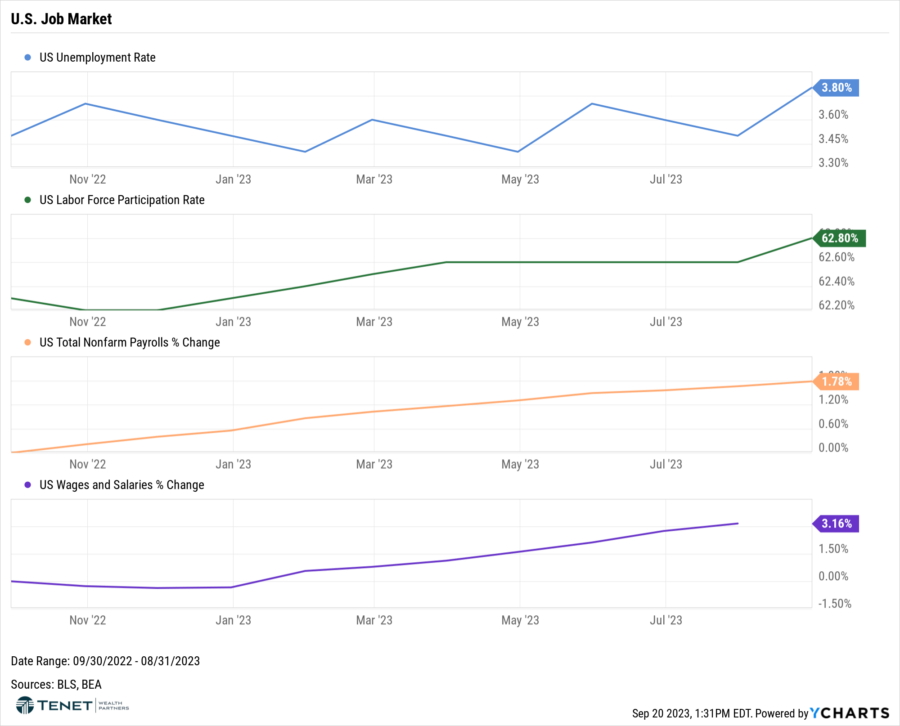
Job Market Outlook
In August, the U.S. economy added 187,000 jobs and the unemployment rate settled in at 3.8%, according to the Labor Department. The increase in the unemployment rate from 3.5% in July can be attributed to the 736,000 workers who entered the labor force in August, which is what one wants to see as average hourly earnings remain strong and wage increases exceed the inflation rate by annual rate of 1%. In addition, the Bureau of Labor Statistics revised down by 110,000 the past two months of job estimates. That revision brings the three-month average of job growth to roughly 150,000 and is another reflection of the overall cooling in the demand for labor. Slower hiring, an increase in the labor force and cooling wage growth are exactly the policy mix that central bankers want to observe.
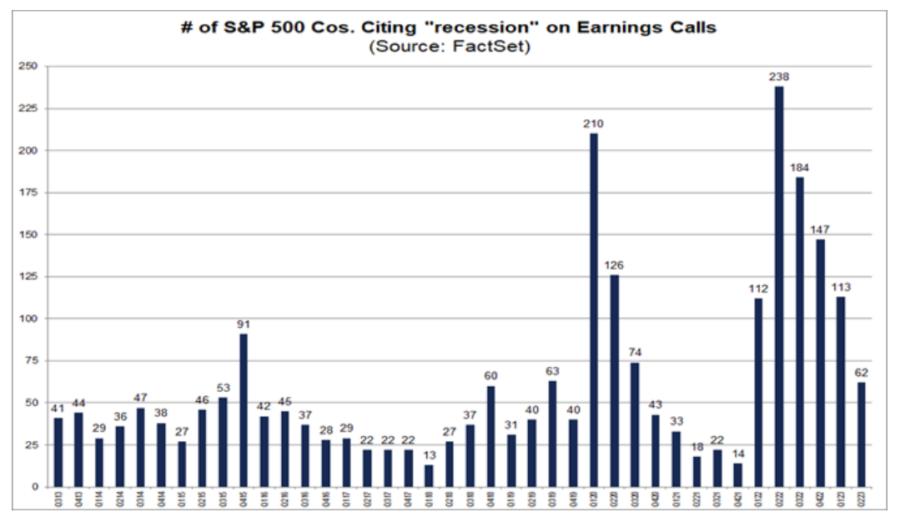
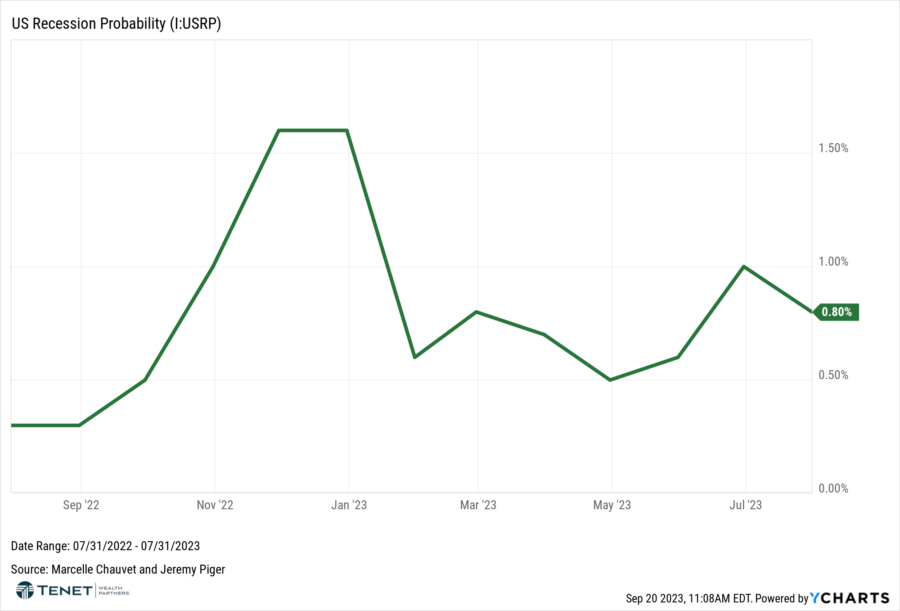
Recession Probability
A potential recession is still on the minds of investors, but seemingly less corporations are concerned, and the probability of a recession has fallen recently. Per FactSet research of S&P 500 earnings call transcripts from June 15 through August 31, the number of S&P 500 companies citing “recession” on earnings calls has declined for four straight quarters. The number of S&P 500 companies citing “recession” on earnings calls for Q2 2023 is 45% below the number in Q1 2023 (113), 58% below the number in Q4 2022 (147), 66% below the number in Q3 2022 (184), and 74% below the number in Q2 2022 (238). In fact, this quarter will mark the lowest number of S&P 500 companies citing “recession” on earnings calls for a quarter since Q4 2021 (14).
According to University of Oregon economics professor Jeremy Piger’s Recession Probability Index, the probability of a recession fell to 0.8% in July, down from 1.0% the prior month and also significantly lower than the 1.6% probability to start 2023.
Registered Representative of Sanctuary Securities Inc. and Investment Advisor Representative of Sanctuary Advisors, LLC. Securities offered through Sanctuary Securities, Inc., Member FINRA, SIPC. Advisory services offered through Sanctuary Advisors, LLC., a SEC Registered Investment Advisor. Tenet Wealth Partners is a DBA of Sanctuary Securities, Inc. and Sanctuary Advisors, LLC.

The information provided in this communication was sourced by Tenet Wealth Partners through public information and public channels and is in no way proprietary to Tenet Wealth Partners, nor is the information provided Tenet Wealth Partner’s position, recommendation or investment advice. Tenet makes no representations as to the accuracy and completeness of information provided herein. Any investment discussed may not be suitable for all investors. Investors must make their own decisions based on their specific investment objectives and financial circumstances. Additional information available upon request.
This material is provided for informational/educational purposes only. This material is not intended to constitute legal, tax, investment or financial advice. Investments are subject to risk, including but not limited to market and interest rate fluctuations. Any performance data represents past performance which is no guarantee of future results. Prices/yields/figures mentioned herein are as of the date noted unless indicated otherwise. All figures subject to market fluctuation and change. Additional information available upon request.
About The Author
Kevan Melchiorre, CFP®Co-Founder & Managing Partner
Kevan Melchiorre co-founded Tenet Wealth Partners in 2021 with a focus on delivering a premier client experience, supported by an innovative and fully integrated approach to wealth planning. As a CERTIFIED FINANCIAL PLANNER™ practitioner with over 15 years of wealth management experience, Kevan partners with affluent individuals, families, and institutions to help align their capital […]
Learn more about Kevan