The S&P 500 recently surpassed 7,600 for the first time, marking another milestone in a year that has seen many new all-time highs. This achievement is encouraging for investors, particularly because multiple sectors have contributed to the broader rally. These positive conditions have also generated enthusiasm around IPOs, especially those connected to artificial intelligence, following years in which relatively few companies chose to go public.
Despite this momentum, persistent concerns about inflation, elevated oil prices, and the absence of a long-anticipated peace deal in Iran continue to weigh on sentiment. Unlike the stock market, these headwinds have put pressure on the bond market, pushing long-term interest rates higher. The 30-year U.S. Treasury yield, for example, briefly touched a nearly 20-year high before pulling back near 5%. Given that headlines of this nature can introduce uncertainty, maintaining perspective and a balanced approach to investing is more important than ever.
Technology stocks continue to support market performance
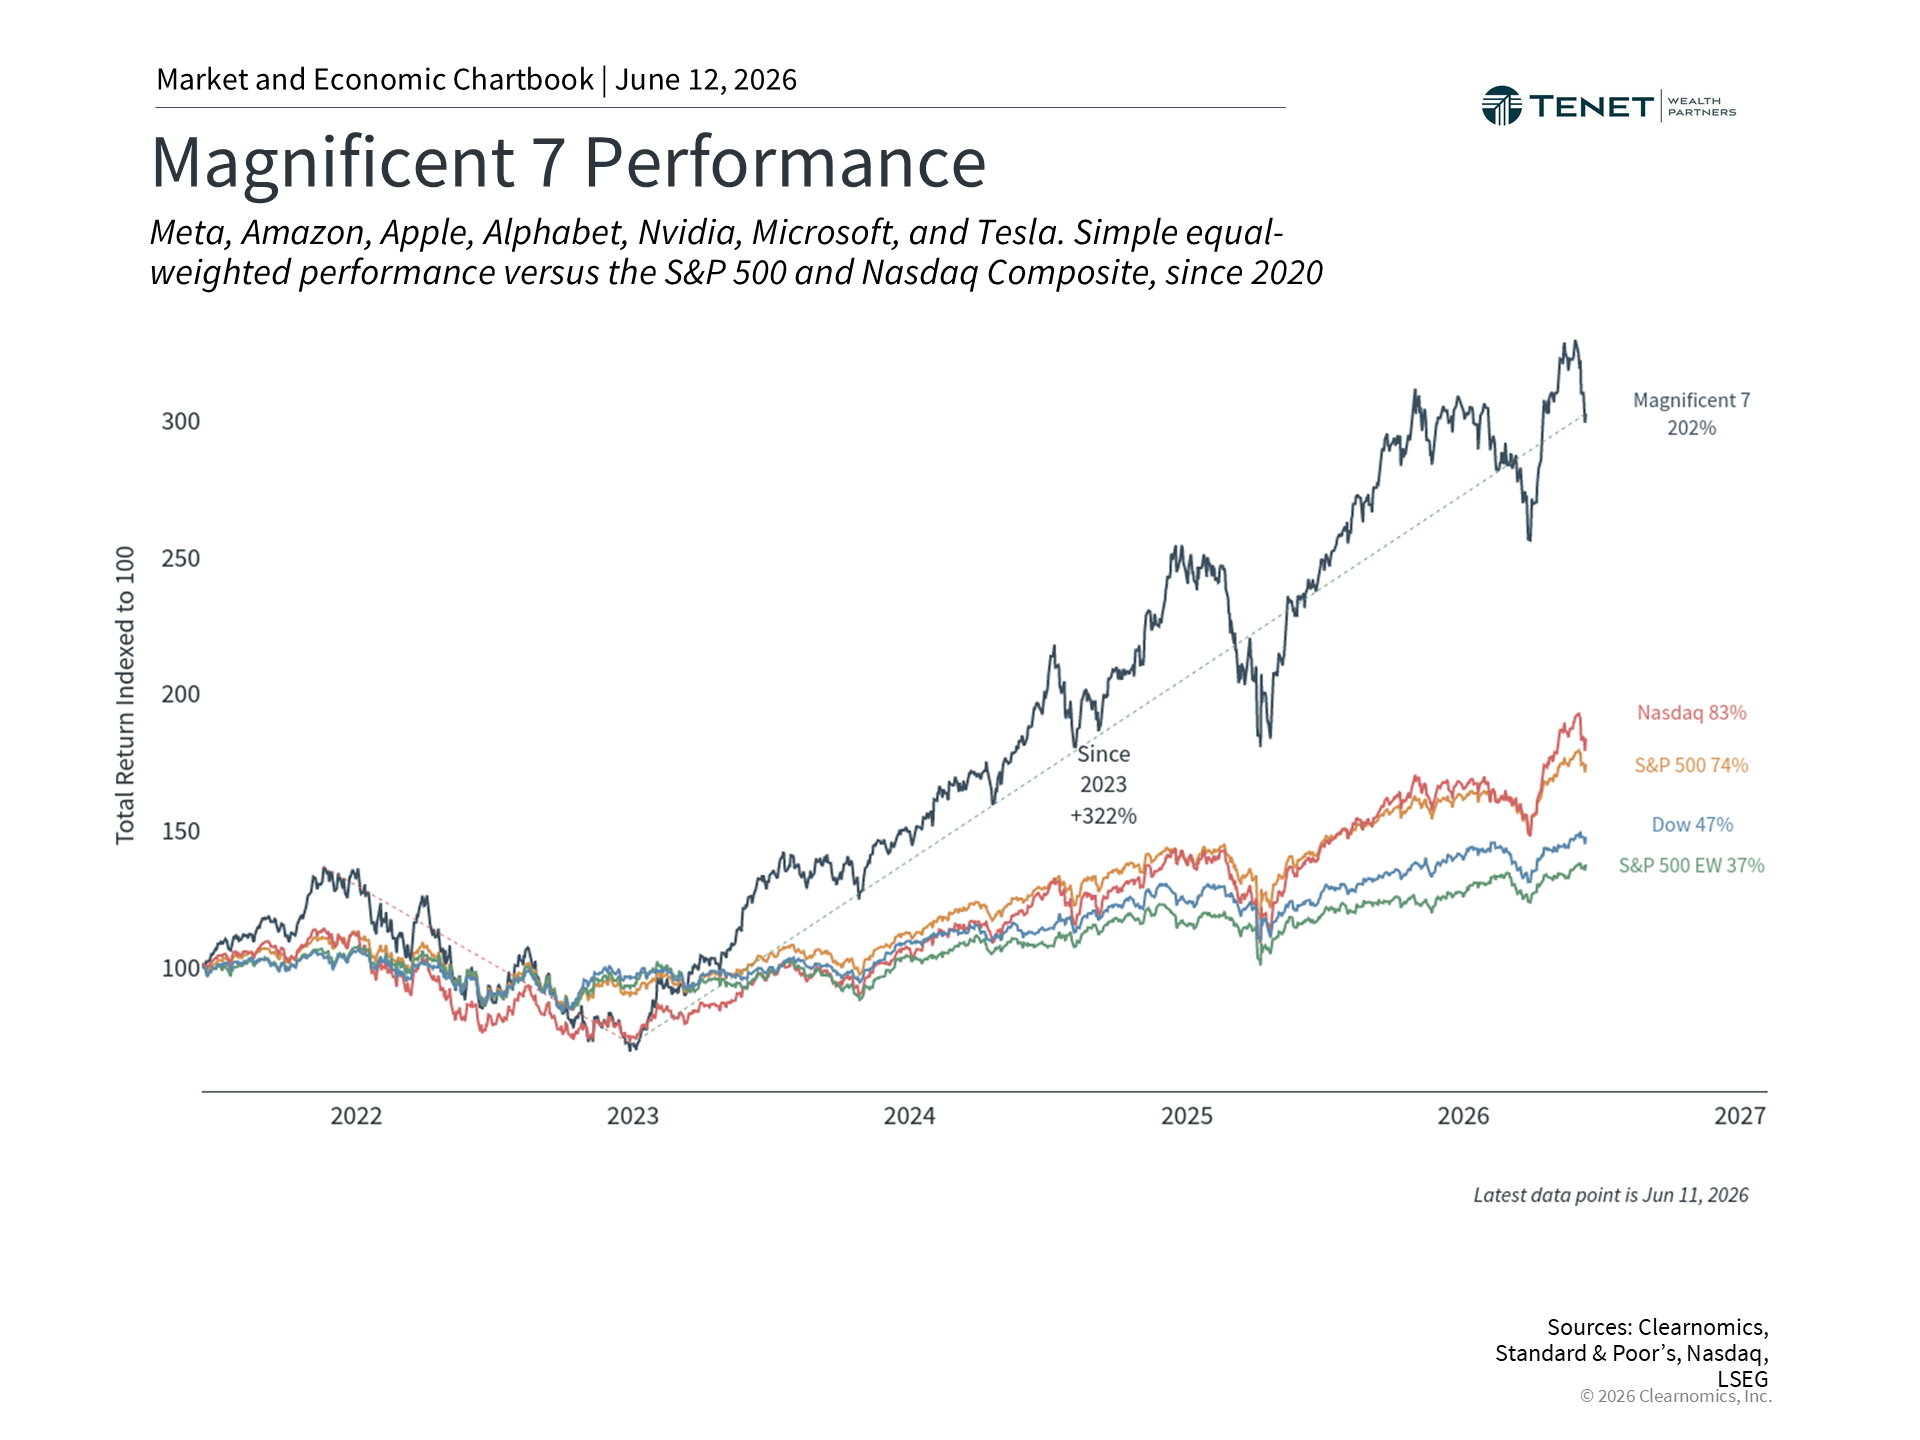 |
Although the energy sector has led market performance recently, technology-related stocks have also made meaningful contributions to portfolio returns this year. The Magnificent 7 now accounts for approximately 35% of the S&P 500. This concentration underscores the importance of thoughtful portfolio construction, as some investors may not be fully aware of how much exposure they carry to these individual companies.
The rally has been supported not only by optimistic sentiment but also by strong underlying fundamentals. S&P 500 earnings growth has been running well above its historical average, and many large companies have continued to deliver positive earnings surprises. Current consensus estimates suggest that the Information Technology and Communication Services sectors could grow earnings by 35.8% and 17.3%, respectively, over the next year.1 Other sectors, including Materials and Energy, are also expected to experience above-average growth.
At the same time, valuations have risen alongside prices. The S&P 500 forward price-to-earnings ratio currently sits near 22x, above the historical average of 16x, while technology stocks trade at a forward P/E over 24x.2 Elevated valuations do not necessarily predict near-term market direction, but they are an important consideration for long-term investors reviewing their asset allocation. Maintaining balance across sectors, market capitalizations, and investment styles can help manage risk while still allowing investors to benefit from prevailing market trends.
IPO activity is returning to public markets – starting with SpaceX
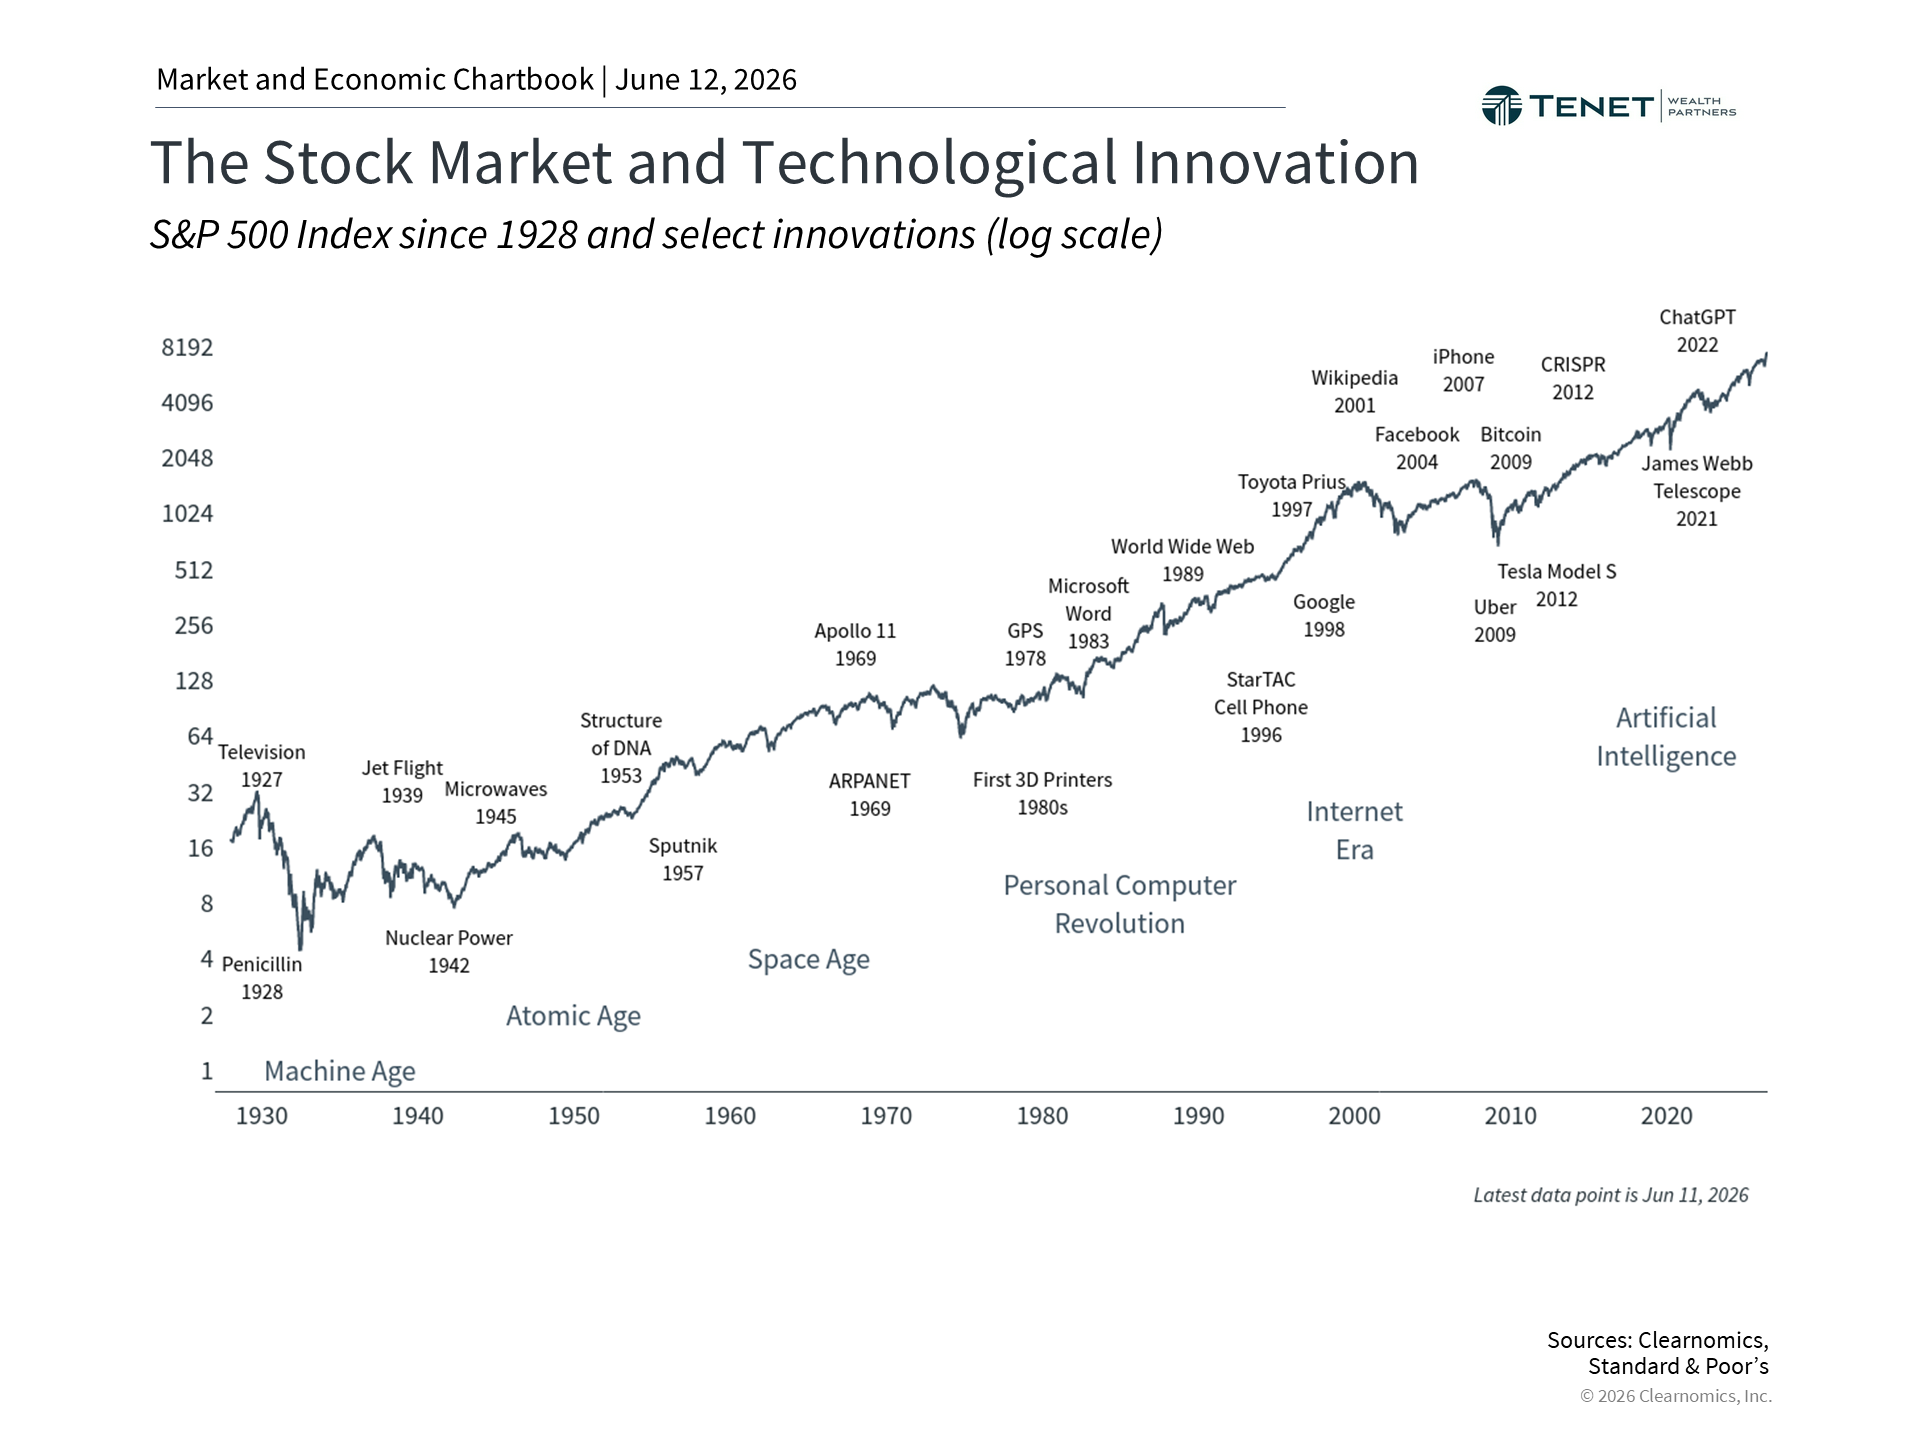 |
The stock market is in a constant state of evolution. Existing companies may be acquired, merged with others, or in some cases cease operations. Meanwhile, new companies can enter major exchanges through an initial public offering, or IPO.
This ongoing change is one reason why the investment opportunity set available today looks notably different from even a decade ago. The FT Wilshire 5000, originally designed to include roughly 5,000 publicly traded U.S. companies, now contains only about 3,400 components.3 This reflects a longer-term trend of companies choosing to remain private for extended periods before pursuing a public listing.
Recently, a number of high-profile companies have reportedly been considering public offerings, including SpaceX, Anthropic, OpenAI, and others.4 Many of these businesses have grown primarily through venture capital and private investment rather than public markets. From that perspective, these potential IPOs are a positive development, as they would make shares available to a broader group of investors. Stock market indices automatically incorporate newly public companies as they grow, meaning that long-term investors gain exposure to successful IPOs over time without needing to invest directly at the time of offering.
Of course, IPOs naturally attract headlines and excitement, and some investors wonder whether participating early represents an opportunity for meaningful gains. However, this is not always the case. Institutional investors and company insiders are typically the ones who participate in the IPO itself, and many have been invested for years before a public offering occurs. Additionally, insiders are often subject to lock-up periods, commonly 180 days, during which they are restricted from selling shares. When these periods expire, the resulting selling pressure can weigh on the stock price, sometimes catching investors off guard.
IPO activity tends to arrive in waves, often coinciding with periods of strong economic conditions when investment capital is abundant and market enthusiasm is elevated. The dot-com boom of the late 1990s is perhaps the most well-known example, but similar patterns have emerged at various other points in history. The post-pandemic market recovery, for instance, saw a surge in Special Purpose Acquisition Company (SPAC) activity, one vehicle through which companies can go public. That wave proved relatively short-lived, highlighting the value of maintaining a long-term perspective.
Long-term interest rates have remained elevated
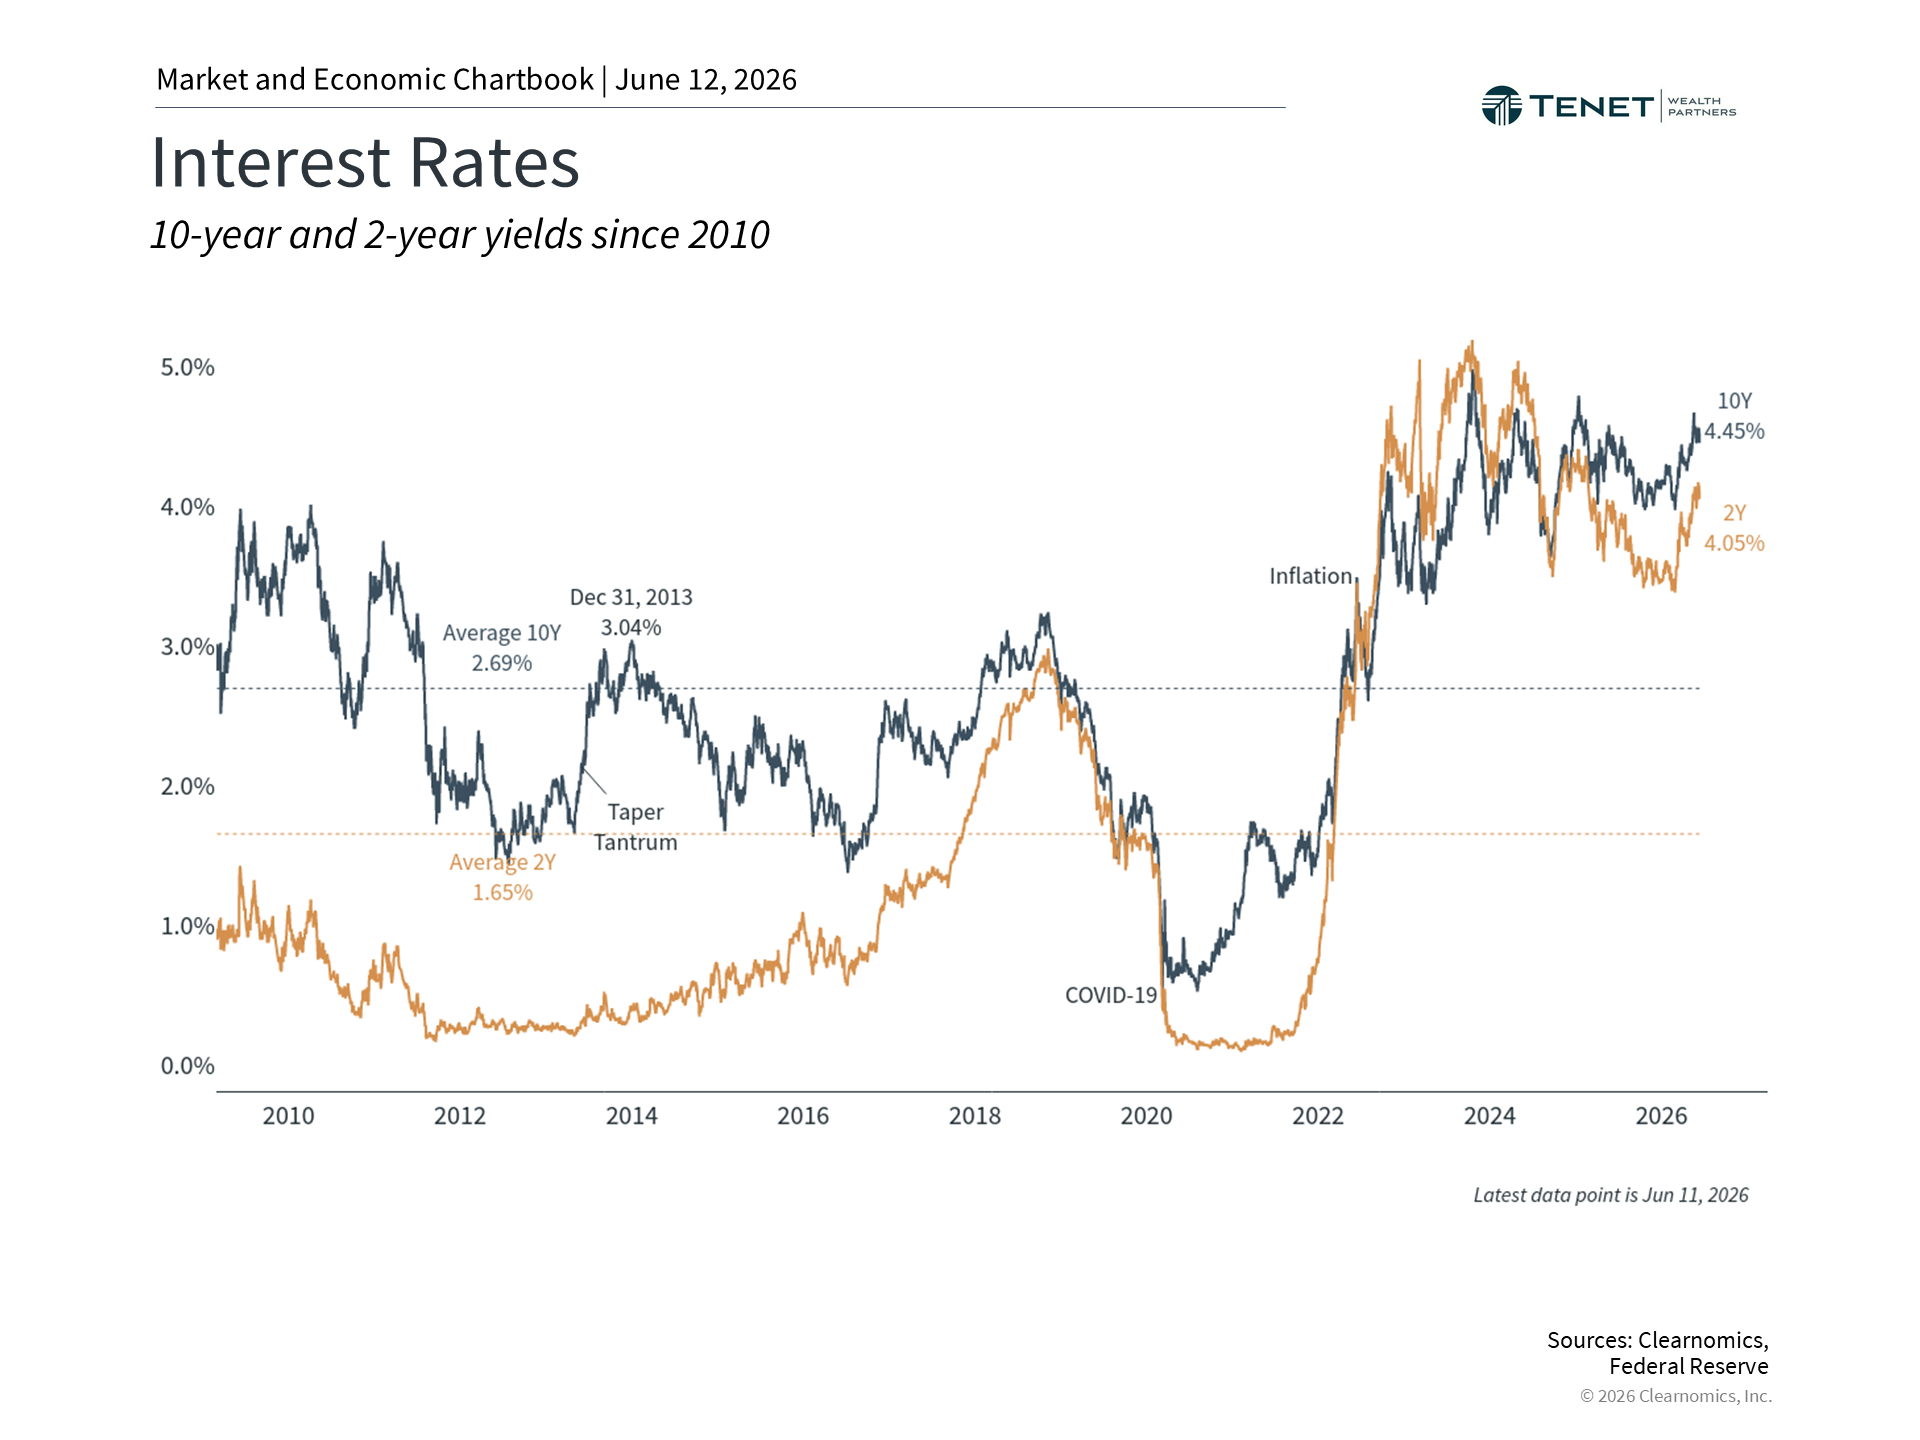 |
Even as the stock market has climbed to new highs, long-term interest rates have continued to rise, driven primarily by inflation concerns that have complicated the Federal Reserve’s policy outlook. Technology stocks are particularly sensitive to changes in interest rates and inflation, as these factors affect the present value of future cash flows. This dynamic contributed to the struggles of technology stocks in 2022 when rates rose sharply, and to their subsequent recovery as inflation moderated in the years that followed.
Higher interest rates carry broad implications across the economy and financial markets. Mortgage rates have moved higher, with the 30-year fixed rate now around 6.5%, above the long-term average of 6.02% since 1990. This affects housing affordability and overall real estate activity. Elevated rates also increase the cost of capital for businesses and raise the discount rate applied to future earnings, which can pressure stock valuations, particularly for growth-oriented companies whose value is heavily tied to future cash flows.
On the other hand, higher interest rates mean that bonds are now offering more meaningful income than they have in many years. Investment grade corporate bonds currently yield around 5.3%, compared to a long-term average of 3.8%, while Treasury’s yield 4.5%, well above their historical average of 2.2%.5 These conditions create more attractive opportunities in fixed income, allowing bonds to play a more meaningful role in diversified portfolios going forward.
Overall, while the stock market has reached new milestones this year, rising interest rates serve as a reminder that the broader economic environment may present future challenges. Upcoming, large IPO’s also may drive more excitement for investors but also potentially more volatility. For long-term investors, the best approach is to maintain a balanced, well-diversified portfolio that may benefit from market growth as well as higher interest rates.
Stay Focused Through Market Milestones and Uncertainty
Market highs, IPO activity, and changing interest rates can create both opportunity and uncertainty. A thoughtful investment plan can help keep your portfolio aligned with your long-term goals.
No pressure. Just a conversation about your portfolio and long-term plan.

References
- Clearnomics research and LSEG data as of May 20, 2026
- Ibid.
- https://cdn.prod.website-files.com/63e3e50fdce0bcaff7861530/6965694be133b820fb1f390d_FT%20Wilshire%205000%20Index%20Series%20Factsheet%20v2%20-%20Dec%202025.pdf
- https://www.wsj.com/topics/subject/initial-public-offerings-ipos
- Bloomberg U.S. Corporate Investment Grade and Bloomberg U.S. Treasury Index yields, as of May 22, 2026
Index Descriptions
S&P 500
The Standard & Poor’s 500 Index is a capitalization-weighted index of 500 stocks designed to measure performance of the broad domestic economy through changes in the aggregate market value of 500 stocks representing all major industries.
The modern design of the S&P 500 stock index was first launched in 1957. Performance prior to 1957 incorporates the performance of the predecessor index, the S&P 90.
NASDAQ
The NASDAQ Composite Index measures all NASDAQ domestic and non-U.S. based common stocks listed on The NASDAQ Stock Market. The market value, the last sale price multiplied by total shares outstanding, is calculated throughout the trading day, and is related to the total value of the Index.
Investment advisory services offered through Tenet Wealth Partners, LLC, a registered investment advisor with the U.S. Securities and Exchange Commission. This material is intended for informational purposes only. It should not be construed as legal or tax advice and is not intended to replace the advice of a qualified attorney or tax advisor. This information is not an offer or a solicitation to buy or sell securities. The information contained may have been compiled from third-party sources and is believed to be reliable.
The information provided in this communication was sourced by Tenet Wealth Partners through public information and public channels and is in no way proprietary to Tenet Wealth Partners, nor is the information provided Tenet Wealth Partner’s position, recommendation or investment advice. Certain statements contained herein may constitute forward-looking statements, which are based on current expectations and subject to change.
This material is provided for informational/educational purposes only. This material is not intended to constitute legal, tax, investment or financial advice. Investments are subject to risk, including but not limited to market and interest rate fluctuations.
Any performance data represents past performance which is no guarantee of future results. Prices/yields/figures mentioned herein are as of the date noted unless indicated otherwise. All figures subject to market fluctuation and change. Additional information available upon request. Index performance is presented for illustrative purposes only and does not represent the performance of any specific investment product or portfolio. An investment cannot be made directly into an index.
About The Author
Kevan Melchiorre, CFP®Co-Founder & Managing Partner
Kevan Melchiorre co-founded Tenet Wealth Partners in 2021 with a focus on delivering a premier client experience, supported by an innovative and fully integrated approach to wealth planning. As a CERTIFIED FINANCIAL PLANNER® practitioner with over 18 years of wealth management experience, Kevan partners with affluent individuals, families, and institutions to help align their capital […]
Learn more about Kevan