There is a saying that smooth seas do not make skillful sailors. When it comes to investing, this has rarely been more applicable than during the first half of 2026. Investors navigated a series of significant events, including the war in Iran, oil prices pushing inflation to multi-year highs, and evolving questions around artificial intelligence (AI). And yet, markets climbed to new all-time highs, corporate earnings grew at a double-digit pace, and many asset classes delivered strong performance. The opening six months of the year served as a powerful reminder of the value of staying invested and maintaining a longer time horizon.
This lesson carries even greater weight today, given that the business cycle has now entered its seventh year while the market cycle is approaching its fifth. For many investors, it can feel as though the same set of concerns, including inflation, Federal Reserve policy, and valuations, have cycled in and out of focus repeatedly. Navigating these competing challenges is not merely a feature of investing; it is precisely why those who stay the course tend to be rewarded over the long run.
The second half of the year will no doubt bring its own unexpected developments, from shifts in the ongoing Middle East conflict to the upcoming midterm election and potential new market activity such as initial public offerings (IPOs). Maintaining perspective as these events unfold will be key for investors.
Key Market and Economic Highlights From the First Half of 20261
- The S&P 500, Nasdaq, and Dow Jones Industrial Average returned 9.6%, 12.8%, and 8.9% year-to-date through the end of June, respectively. The second quarter was historically strong, with the S&P 500 returning 14.9%, the Nasdaq 21.4%, and the Dow 12.9%.
- The Bloomberg U.S. Aggregate Bond Index rose 0.6% year-to-date. The 10-year Treasury yield ended the second quarter at 4.47%, up from 4.17% at the start of the year.
- Developed market international stocks (MSCI EAFE) gained 7.7% and emerging market stocks (MSCI EM) returned 22.7% year-to-date, both in U.S. dollar terms.
- The Bloomberg Commodities Index rose 12.3% year-to-date, driven by a strong first quarter gain of 23.3%, partially offset by a decline of 8.9% in the second quarter.
- Brent crude peaked just under $120 per barrel in May before closing the quarter at $73 per barrel.
- Gold prices fell to $4,007 per ounce while Bitcoin declined to a recent low of $58,633.
- Headline CPI rose 4.2% year-over-year in May, driven largely by energy prices. Core CPI, which excludes food and energy, rose 2.9%.
- The Federal Reserve kept rates unchanged at 3.50% to 3.75% through the first half of the year. Kevin Warsh was sworn in as Fed Chair in May.
The Business Cycle Is Now in Its Seventh Year of Expansion
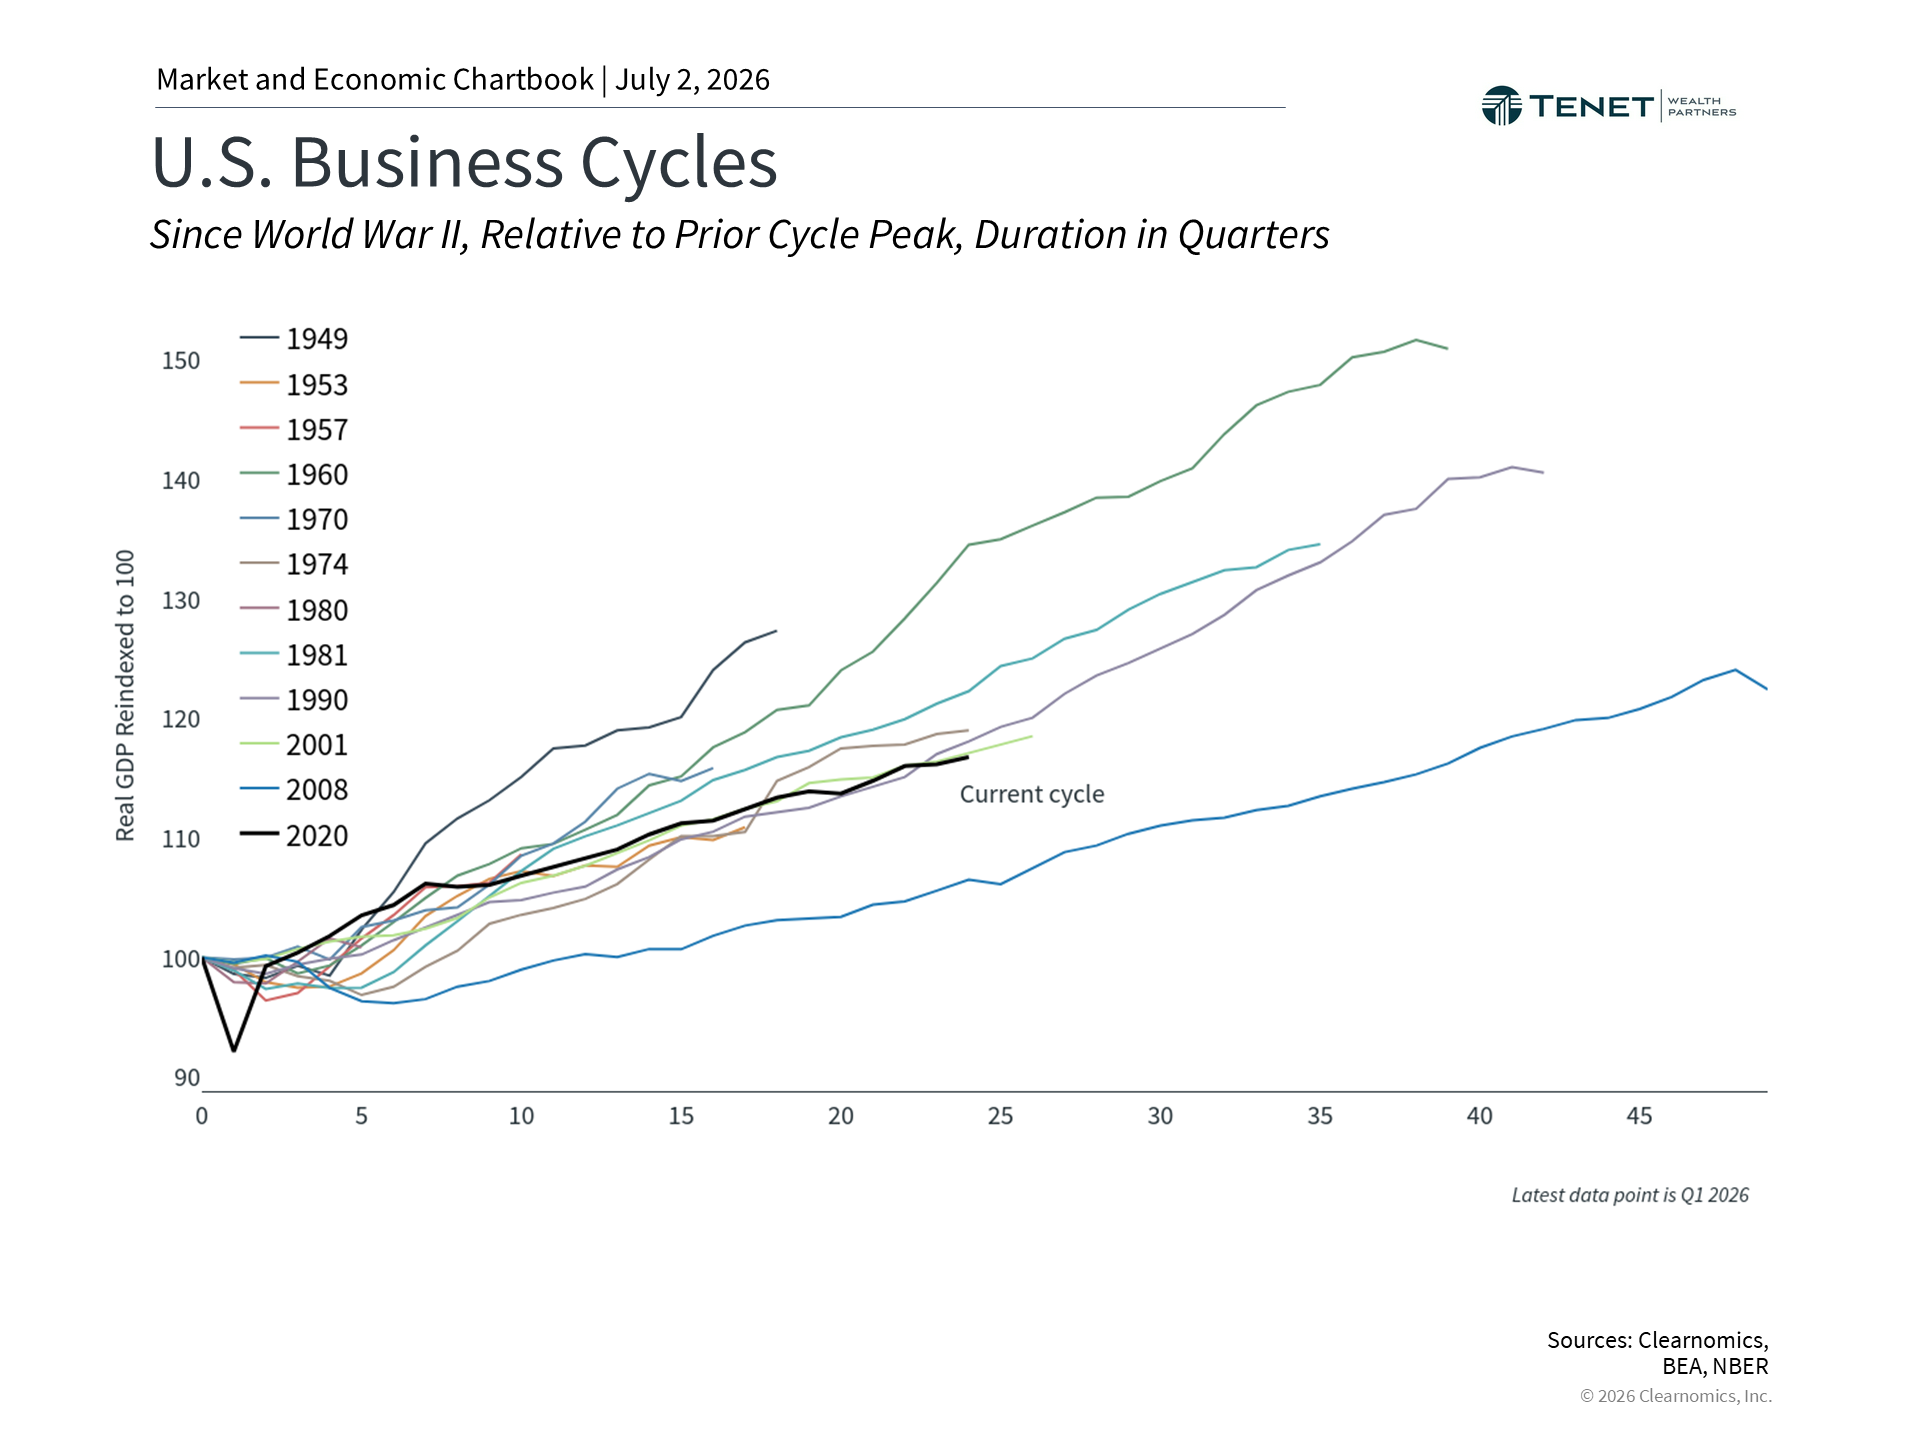 |
Some investors may be surprised to learn that the current business cycle began in April 2020, in the depths of the pandemic, and just passed its sixth anniversary during the second quarter. Along the way, there have been multiple moments when economists and investors feared a potential recession, including when inflation peaked in 2022 and when tariffs disrupted trade last year. Through each of these episodes, the economy demonstrated remarkable resilience, continuing to grow despite the headwinds.
The business cycle influences virtually every dimension of investing and financial planning, from mortgage costs to wage growth. A healthy economy drives consumer spending and business investment, which in turn fuels corporate earnings and ultimately stock market performance. While the stock market and the broader economy are not identical, they are often closely interconnected. The chart above places the current cycle in historical context. The longest expansions on record, including the recovery following the 2008 financial crisis and the 1990s boom, each lasted a decade or more.
Where does the economy stand today? Inflation remains elevated but could moderate if oil prices stay low. The labor market has regained momentum, reversing last year’s concerns about sluggish hiring. The dollar has stabilized and recovered more recently, trade conditions remain uncertain but have improved, and business investment has picked up. Consumers feel cautious yet continue to spend on both essential and discretionary goods. On balance, the economy appears healthy overall despite some mixed signals, a backdrop that has historically been constructive for financial markets over the long run.
A Broad Range of Asset Classes Has Contributed to Portfolio Returns This Year
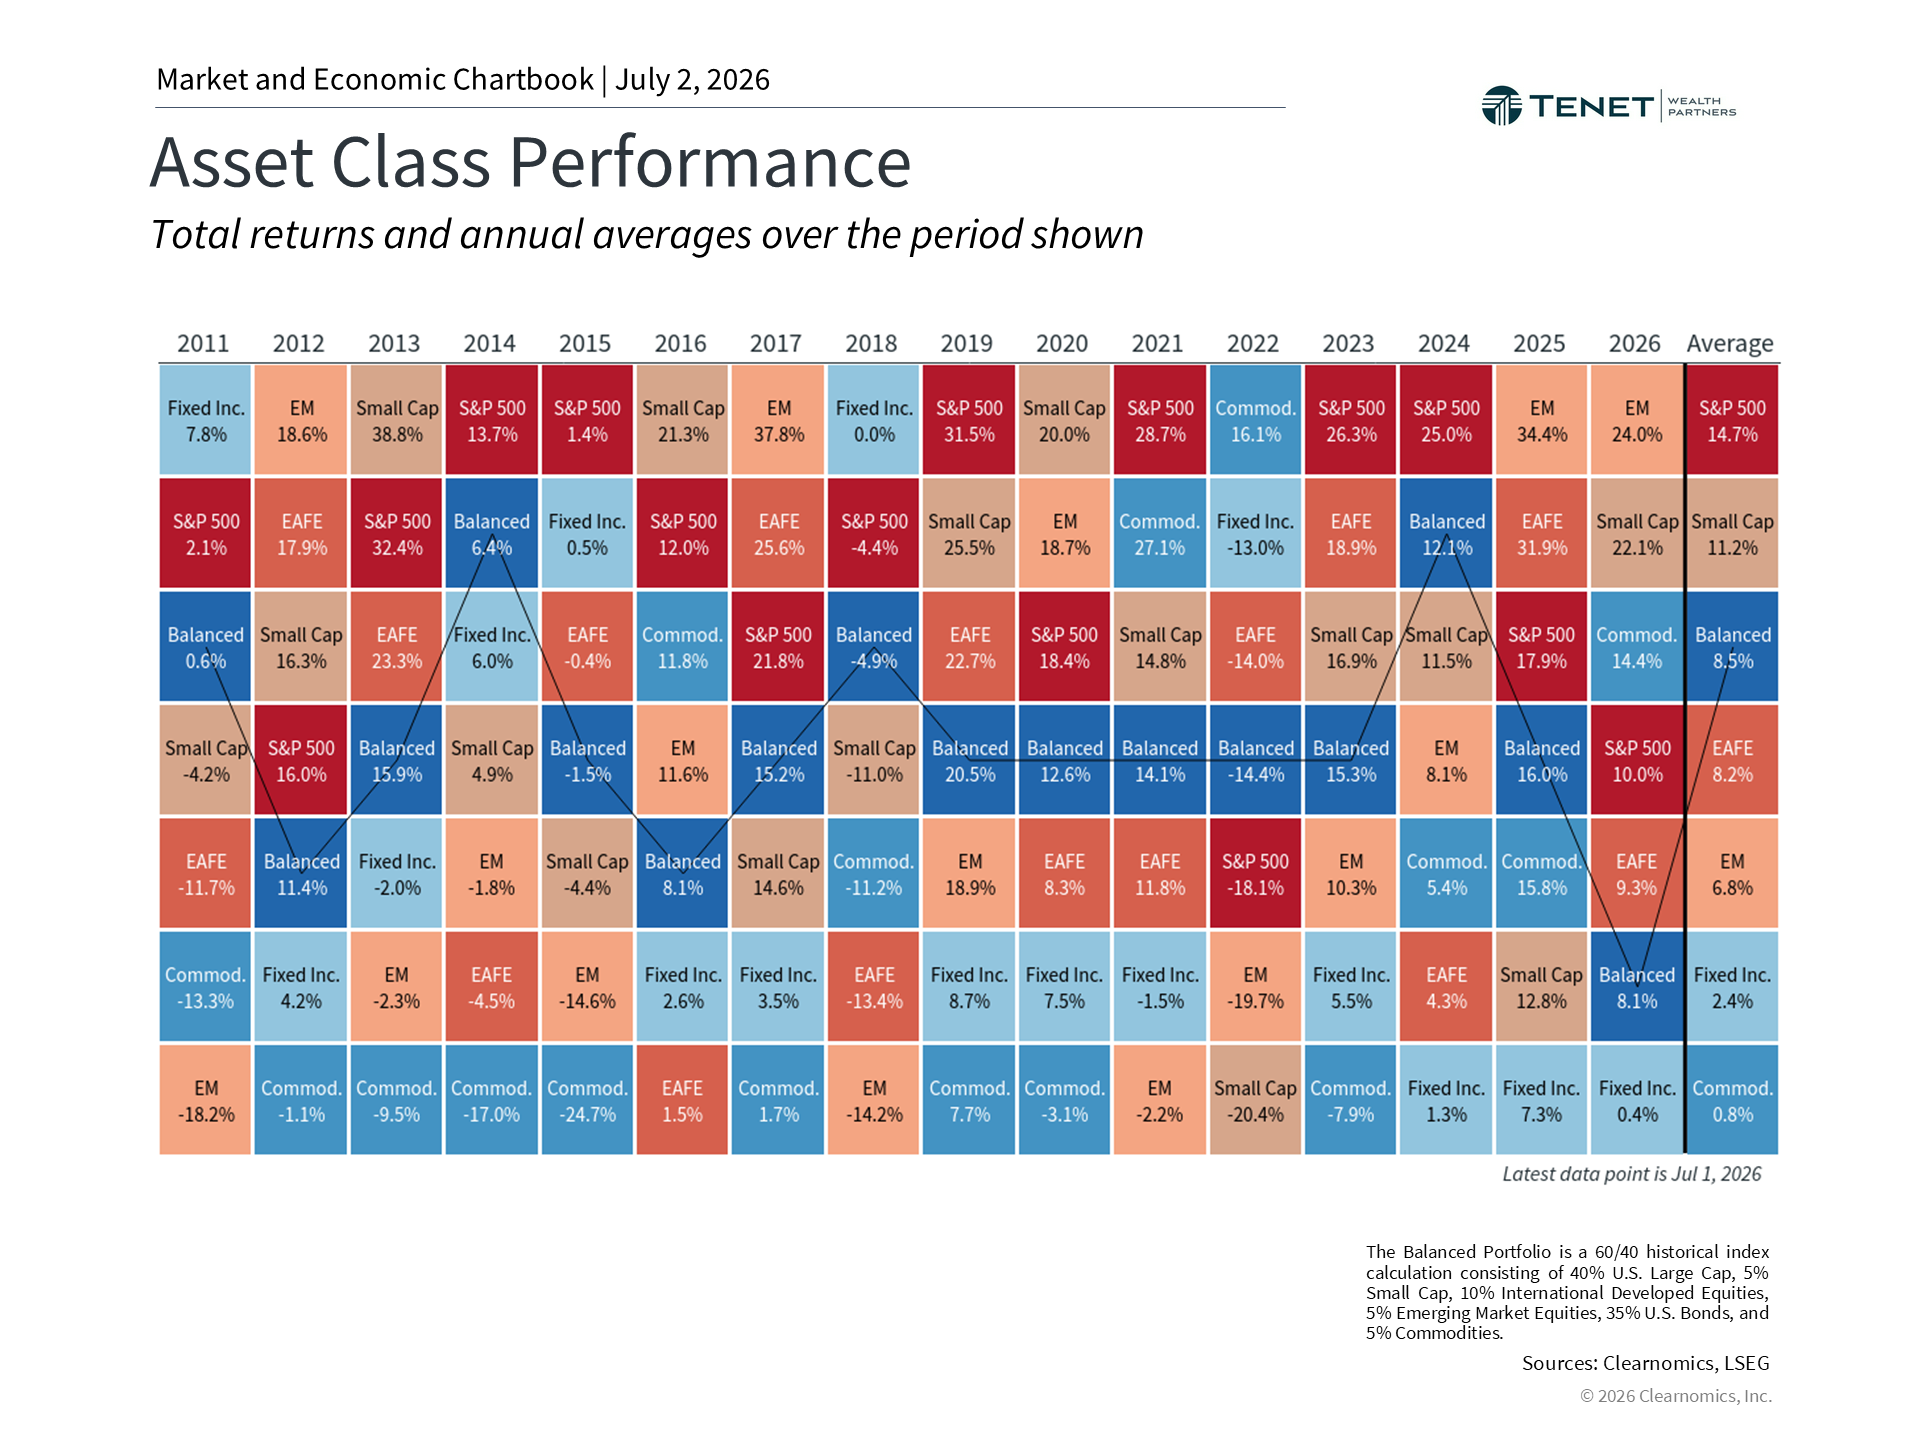 |
A wide variety of global asset classes have contributed positively to portfolios so far this year, building on last year’s trend. These gains have not been limited to large cap stocks represented by the S&P 500; small caps, emerging markets, and commodities have also participated, as shown in the chart above. The second quarter, in particular, ranked among the strongest on record, partly reflecting the timing of the war in Iran, which helped set the stage for a market recovery beginning at the start of April.
Several themes have underpinned these returns, including economic strength, optimism around a potential peace deal in Iran, and enthusiasm for AI. Many of these factors have contributed to robust corporate earnings growth, with profits for S&P 500 companies rising more than 20% over the past twelve months.2 The favorable market environment has also generated a wave of notable IPOs, including SpaceX in the second quarter and the anticipated listings of OpenAI and Anthropic, both AI companies.
While investors often focus on the initial days of an IPO when media coverage is most intense, the real benefits for long-term investors tend to accumulate over time. These new listings broaden the opportunity set available to all investors, which is particularly meaningful given the trend of companies remaining private for longer periods. What ultimately matters is how these businesses perform over the years and decades that follow, much as the largest technology companies today have grown through many market and economic cycles.
These positive trends do mean that U.S. stock valuations are historically elevated. The S&P 500 currently trades at a price-to-earnings ratio of 20x, above the long-term historical average of 16x.3 Valuation ratios like these are not reliable predictors of near-term market direction. Rather, they serve as useful guides when constructing long-term portfolios, particularly when evaluating other asset classes and managing risk. Taken together, this year’s asset class performance underscores the importance of maintaining a well-balanced portfolio.
Inflation Remains Elevated but Easing Oil Prices Offer Some Relief
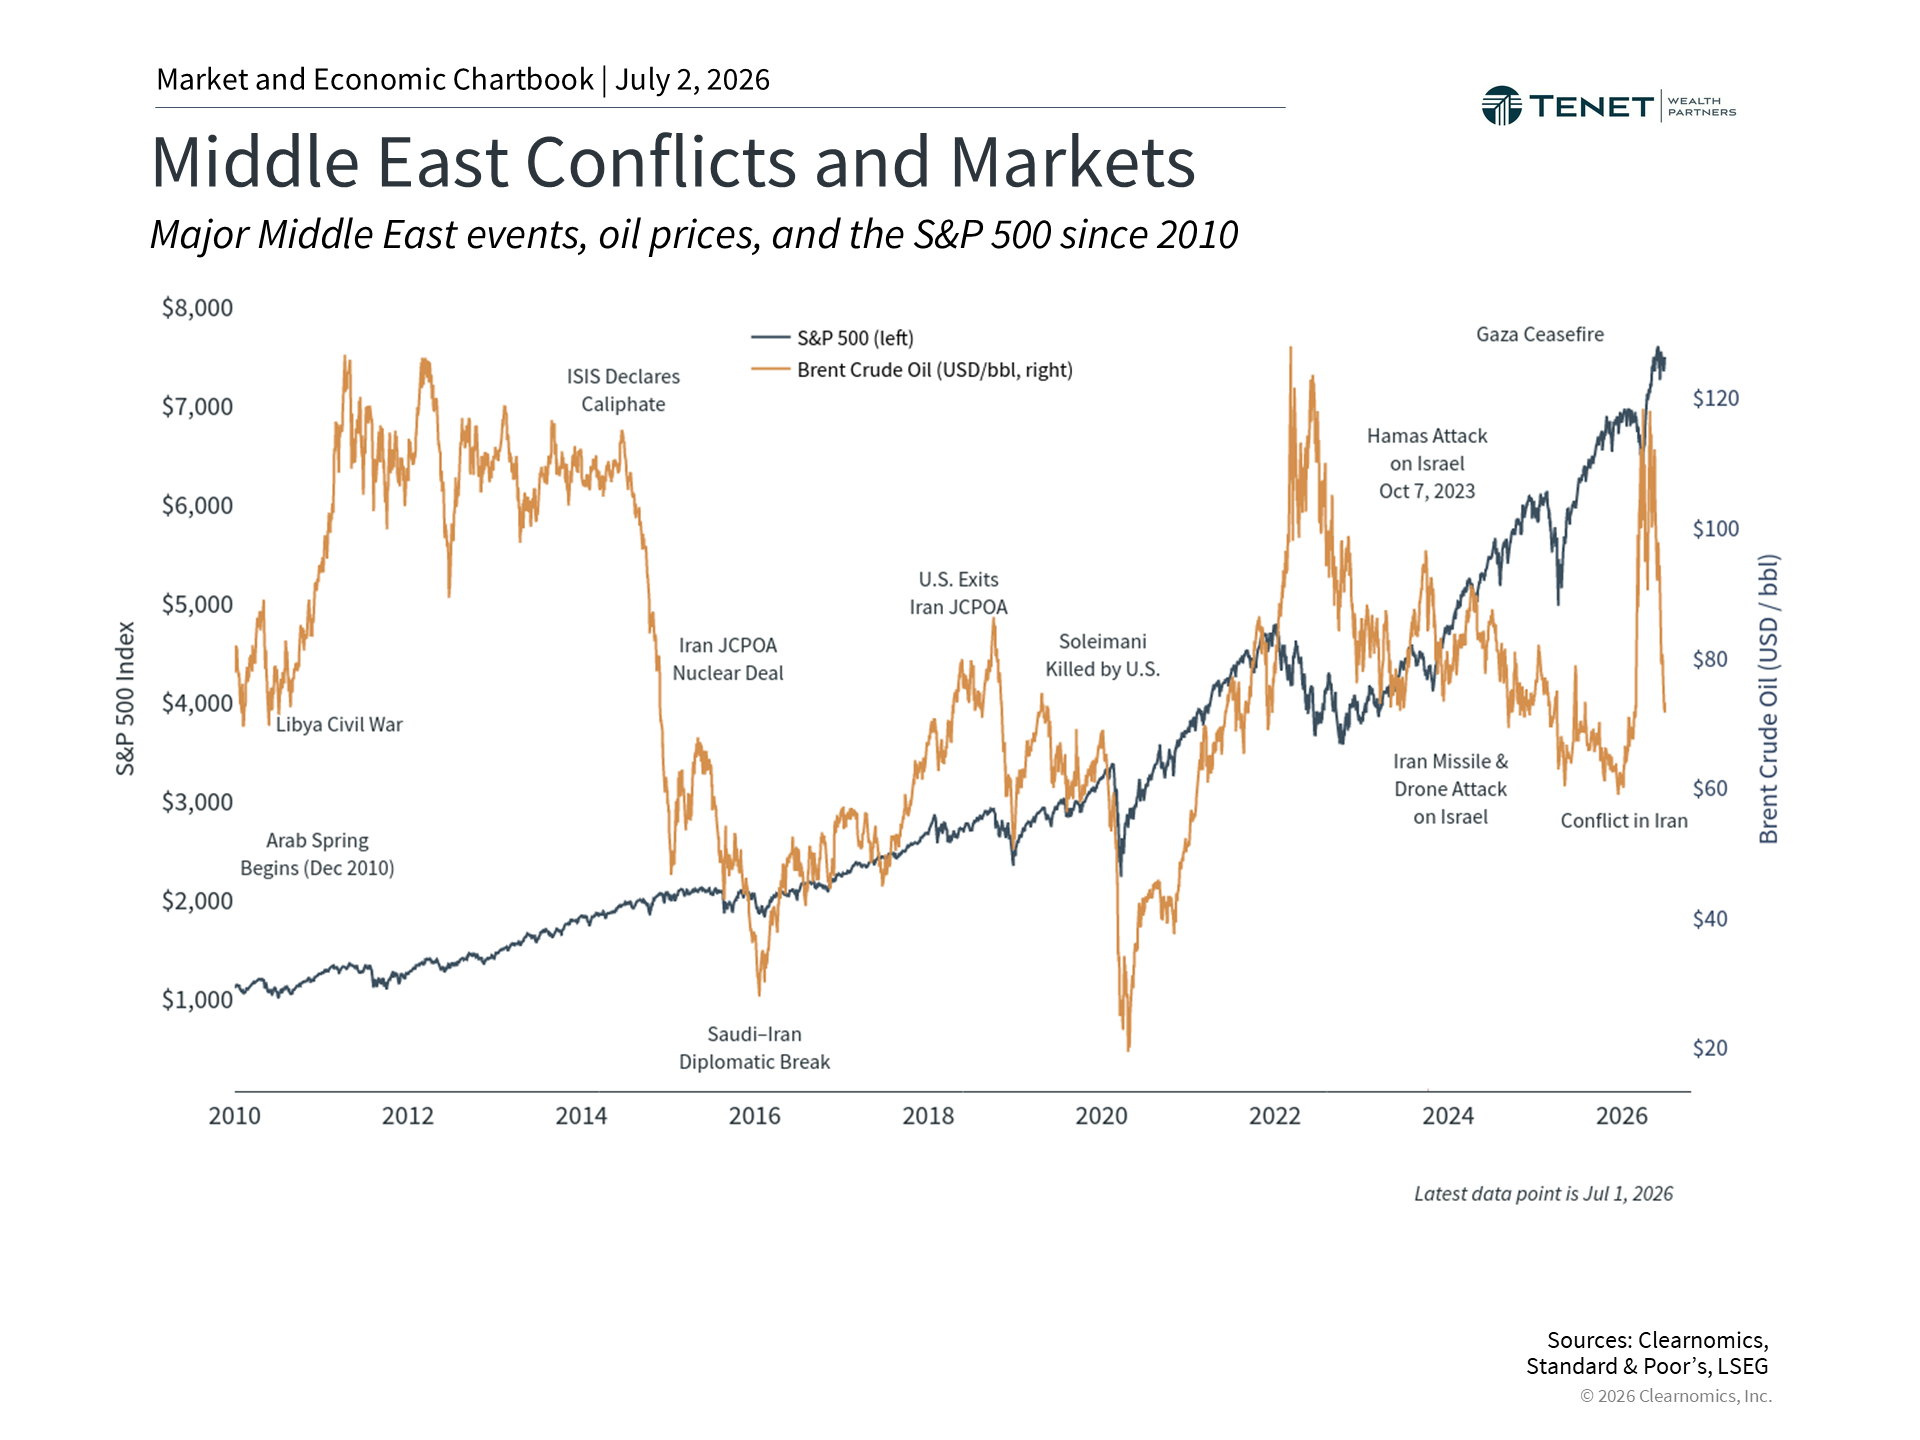 |
The fluctuations stemming from the conflict in Iran have impacted the U.S. economy most directly at the gas pump. Disruptions to oil transportation through the Strait of Hormuz pushed Brent crude to nearly $120 per barrel before prices pulled back meaningfully. In recent weeks, oil prices have declined to around $70 per barrel, approaching pre-conflict levels. Gasoline prices have followed a similar trajectory on a delayed basis, peaking above $4.50 per gallon nationally before retreating below $4.00 per gallon more recently.4
These energy price swings have had a direct impact on inflation. The Consumer Price Index rose 4.2% year-over-year in May, its highest reading in several years, with the gasoline component jumping 40.5% over the same period. Importantly, core CPI, which strips out food and energy, increased only 2.9%.5 This distinction is very important because it suggests that inflationary pressures have been mainly concentrated in fuel costs rather than reflecting a broader, more entrenched pattern.
With oil prices declining more recently, many economists are hopeful that inflation may be near its peak. This pattern echoes prior geopolitical shocks that affected oil supply, such as Russia’s invasion of Ukraine in 2022, and several other historical episodes shown in the chart above. Once conditions stabilized in those instances, oil prices generally recovered, and inflation rates moderated over time.
Market Volatility Has Remained Fairly Manageable Throughout the Year
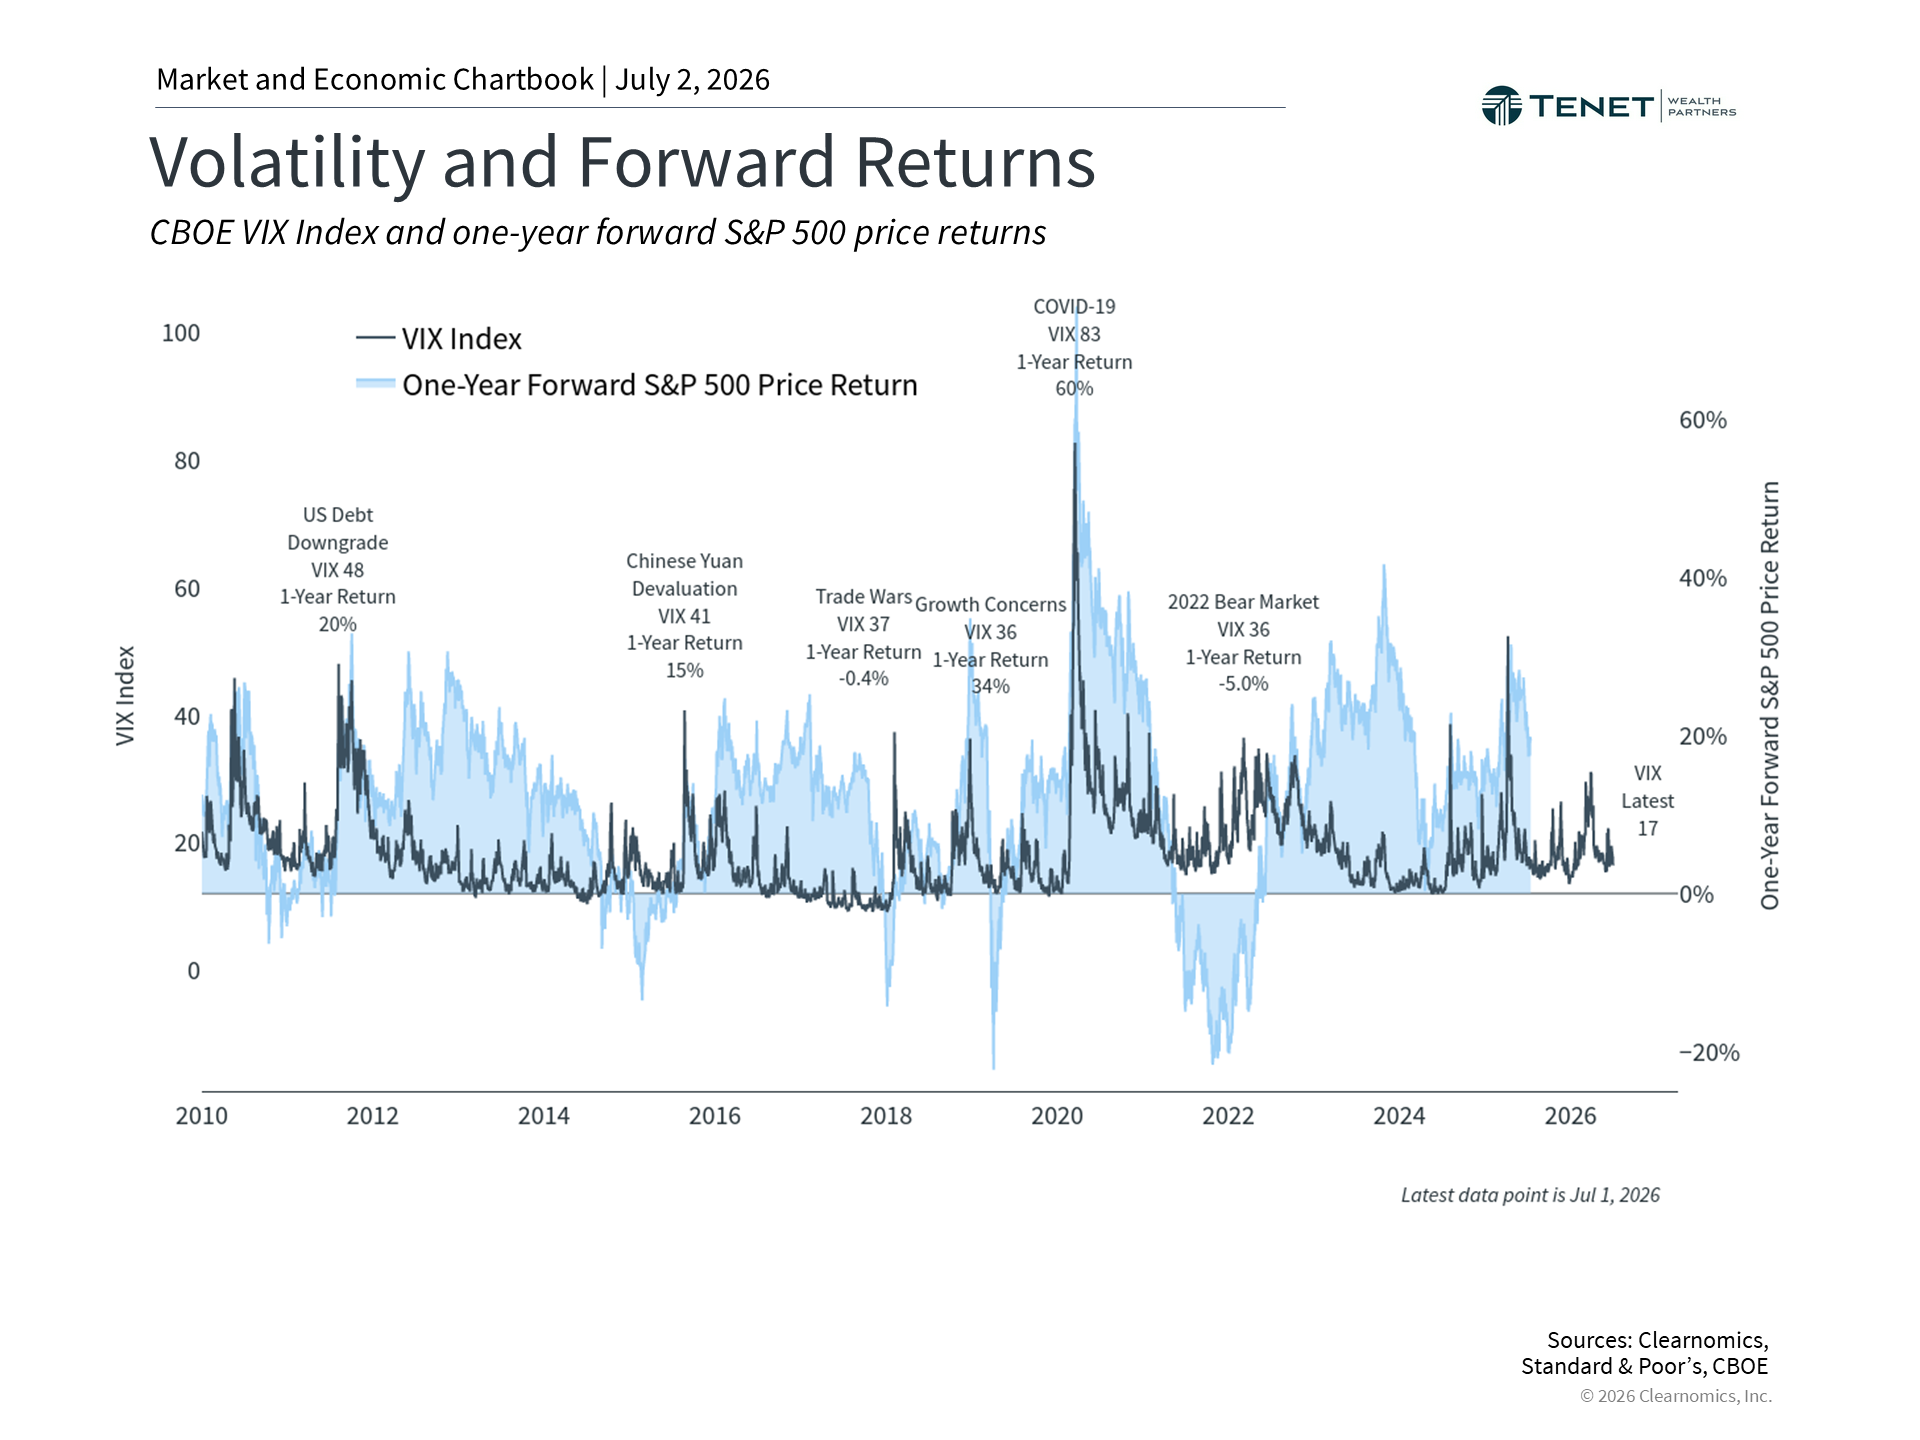 |
Investors have become familiar with brief bouts of volatility triggered by macroeconomic developments. Between tariffs, the Middle East conflict, and uncertainty surrounding Federal Reserve policy, these events have produced short-lived market swings over just the past year. This can be observed in the VIX, a widely used measure of stock market volatility. Encouragingly, the current VIX reading of 16 sits below its long-term average of 18.4 and well below recent peaks, as illustrated in the chart above. This also highlights that periods of elevated volatility can represent some of the most compelling market opportunities.
Another useful lens for understanding how market moves affect investors is the largest annual pullback. So far in 2026, the S&P 500’s greatest peak-to-trough decline has been 9%. While pullbacks of this magnitude are never comfortable, markets have a tendency to rebound when investors least anticipate it. Not only has the market fully recovered from its earlier decline, but the S&P 500 has reached 24 new all-time highs so far this year.6
The first half of the year illustrates that the most significant risk for investors navigating these episodes is not the volatility itself, but the way they respond to it. The temptation to time the market during periods of uncertainty is understandable, but it can often produce unfavorable outcomes. A more effective approach is to hold a portfolio constructed to endure all phases of the market cycle while remaining aligned with long-term financial objectives. This positions investors to better handle the inevitable periods of uncertainty that the second half of the year may bring.
The Case for Staying Invested Remains as Strong as Ever
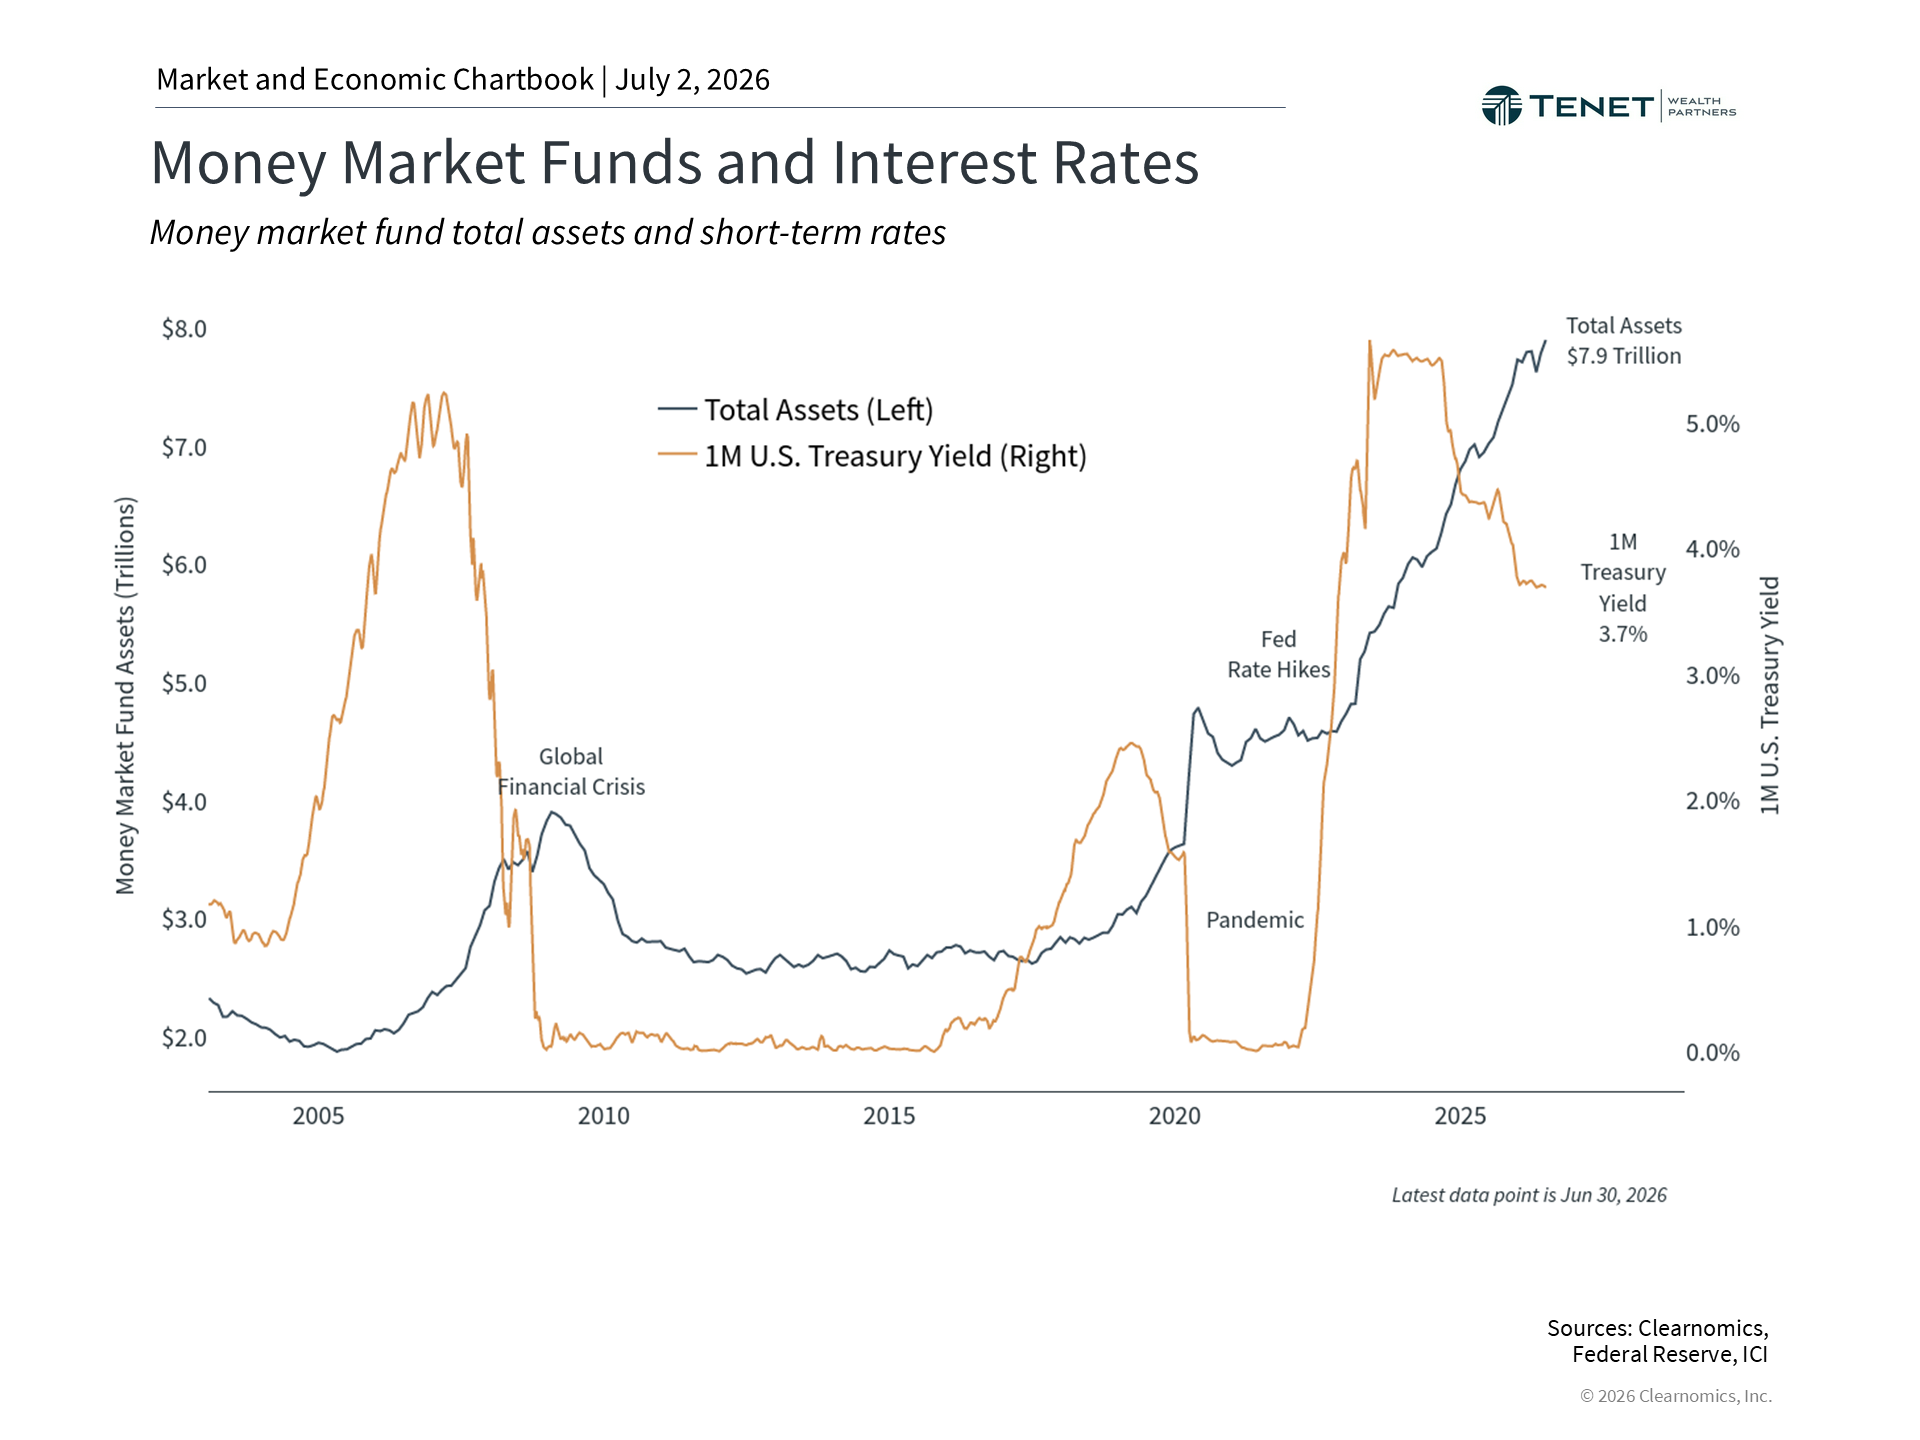 |
One consequence of investors moving to the sidelines during volatile periods is often described as “cash on the sidelines.” The central challenge with this approach is determining the right moment to re-enter the market. The chart above illustrates just how significant these cash holdings have become. Money market fund assets have reached a record $7.9 trillion, more than double their pre-pandemic level when interest rates were near zero. This reflects both the market uncertainty of recent years and a period of higher short-term rates that made cash comparatively attractive.
Although cash may appear safe and stable on the surface, the challenge is that cash yields frequently fail to keep pace with inflation. For instance, current average rates on certificates of deposit mean that the real income from cash is negative after adjusting for inflation.7 Even when nominal yields on money market funds and short-term instruments look appealing, maintaining those rates over time can be difficult, and inflation further erodes their value. The net result is that the purchasing power of cash holdings can diminish meaningfully over time.
This is precisely why holding a balanced portfolio that can benefit from growth, income generation, and capital preservation remains so important. This principle will only become more relevant as both the market and economic cycle continue to evolve.
Overall, the first half of 2026 has rewarded investors who stayed diversified and maintained a long-term perspective, even as geopolitical and economic headlines created short-term uncertainty. This underscores the continued importance of remaining disciplined and maintaining a well-diversified portfolio as we enter the second half of the year.
Stay Focused on What Matters Most
Market headlines may change quickly, but your financial plan should remain grounded in your long-term goals. Connect with Tenet Wealth Partners to discuss whether your investment strategy continues to reflect where you want to go.
No pressure. Just a conversation about your financial plan.
References
- All figures are as of June 30, 2026 and are on a price return basis unless otherwise noted
- Clearnomics research and LSEG data as of June 30, 2026
- Ibid.
- https://gasprices.aaa.com/
- https://www.bls.gov/news.release/cpi.nr0.htm
- Clearnomics research and Standard & Poor’s data as of June 30, 2026
- Clearnomics research and FDIC data as of June 30, 2026
Index Descriptions
S&P 500
The Standard & Poor’s 500 Index is a capitalization-weighted index of 500 stocks designed to measure performance of the broad domestic economy through changes in the aggregate market value of 500 stocks representing all major industries.
Dow Jones Industrial Average
The Dow Jones Industrial Average consists of 30 stocks that are major factors in their industries and widely held by individuals and institutional investors.
NASDAQ
The NASDAQ Composite Index measures all NASDAQ domestic and non-U.S. based common stocks listed on The NASDAQ Stock Market. The market value, the last sale price multiplied by total shares outstanding, is calculated throughout the trading day, and is related to the total value of the Index.
MSCI Emerging Markets Index
The MSCI EM (Emerging Markets) Index is a free float-adjusted market capitalization weighted index that is designed to measure the equity market performance of the emerging market countries of the Americas, Europe, the Middle East, Africa and Asia. The MSCI EM Index consists of the following emerging market country indices: Brazil, Chile, Colombia, Mexico, Peru, Czech Republic, Egypt, Greece, Hungary, Poland, Qatar, Russia, South Africa, Turkey, United Arab Emirates, China, India, Indonesia, Korea, Malaysia, Philippines, Taiwan, and Thailand.
MSCI EAFE Index
The MSCI EAFE Index is a free float-adjusted market capitalization index that is designed to measure the equity market performance of developed markets, excluding the US & Canada. The MSCI EAFE Index consists of the following developed country indices: Australia, Austria, Belgium, Denmark, Finland, France, Germany, Hong Kong, Ireland, Israel, Italy, Japan, the Netherlands, New Zealand, Norway, Portugal, Singapore, Spain, Sweden, Switzerland and the UK.
Bloomberg US Aggregate Bond Index
The Bloomberg U.S. Aggregate Bond Index is an index of the U.S. investment-grade fixed-rate bond market, including both government and corporate bonds.
Investment advisory services offered through Tenet Wealth Partners, LLC, a registered investment advisor with the U.S. Securities and Exchange Commission. This material is intended for informational purposes only. It should not be construed as legal or tax advice and is not intended to replace the advice of a qualified attorney or tax advisor. This information is not an offer or a solicitation to buy or sell securities. The information contained may have been compiled from third-party sources and is believed to be reliable.
The information provided in this communication was sourced by Tenet Wealth Partners through public information and public channels and is in no way proprietary to Tenet Wealth Partners, nor is the information provided Tenet Wealth Partner’s position, recommendation or investment advice. Certain statements contained herein may constitute forward-looking statements, which are based on current expectations and subject to change.
This material is provided for informational/educational purposes only. This material is not intended to constitute legal, tax, investment or financial advice. Investments are subject to risk, including but not limited to market and interest rate fluctuations.
Any performance data represents past performance which is no guarantee of future results. Prices/yields/figures mentioned herein are as of the date noted unless indicated otherwise. All figures subject to market fluctuation and change. Additional information available upon request. Index performance is presented for illustrative purposes only and does not represent the performance of any specific investment product or portfolio. An investment cannot be made directly into an index.
About The Author
Kevan Melchiorre, CFP®Co-Founder & Managing Partner
Kevan Melchiorre co-founded Tenet Wealth Partners in 2021 with a focus on delivering a premier client experience, supported by an innovative and fully integrated approach to wealth planning. As a CERTIFIED FINANCIAL PLANNER® practitioner with over 18 years of wealth management experience, Kevan partners with affluent individuals, families, and institutions to help align their capital […]
Learn more about Kevan