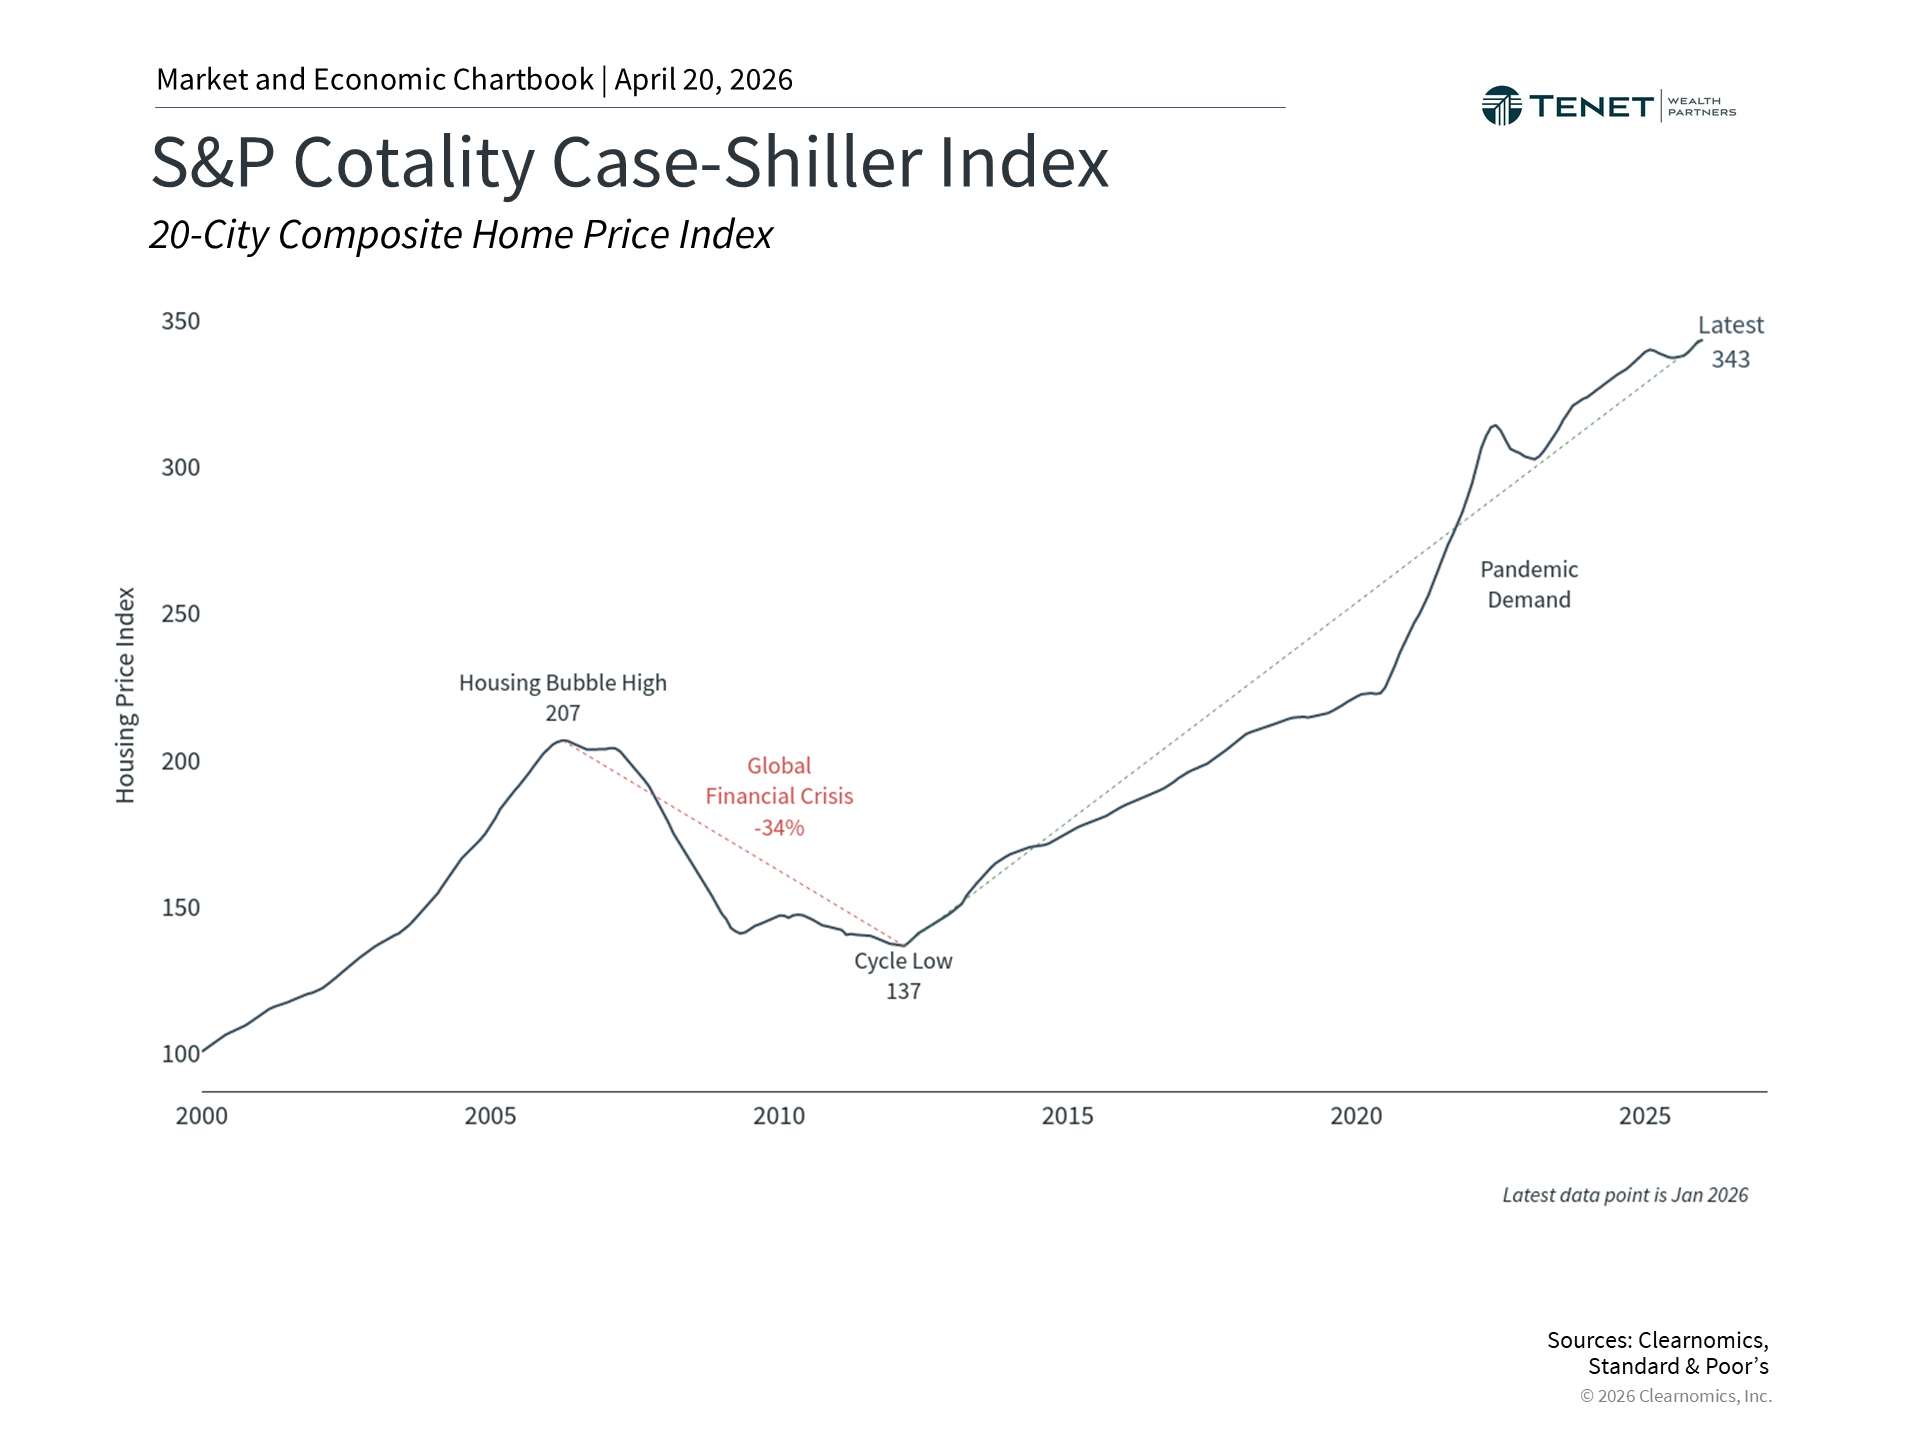
For most households, a home is far more than just a place to live — it is typically their most significant financial asset, their largest monthly expense, and also their primary source of debt. At the macroeconomic level, the housing market is closely linked to consumer confidence and overall economic expansion. In other words, if people feel good about their housing situation and ability to pay for housing, that generally lends to a higher level of overall consumer confidence and potential spending. While investor focus has largely centered on geopolitical tensions and market volatility, the fact that home prices remain near all-time highs based on widely followed housing indices continues to carry meaningful implications for financial planning.
Housing activity is uneven, yet prices hold near record highs
 |
Across a range of measures, housing activity has been inconsistent in recent years. For prospective buyers, mortgage rates represent a significant affordability hurdle. The 30-year fixed mortgage rate currently sits around 6.3% (as of mid-April 2026, based on publicly available data) — well above the historic lows of 3% or less seen in 2020 and 2021, and above the average of 4.6% since 2008. As a result, the monthly cost of homeownership is considerably higher than it was just a few years ago, even for buyers with substantial down payments.
Homeowners who secured mortgage rates near historic lows over the past decade often find it difficult to justify selling and surrendering those favorable terms. This dynamic has constrained the supply of existing homes, contributing to a tighter overall market. In March, existing home sales volume declined 3.6% (according to publicly available housing data sources), reversing earlier gains made this year and returning close to year-ago lows.
In response, new construction activity has picked up, with housing starts reaching an annualized pace of 1.5 million units in January (based on U.S. Census Bureau data). However, it will take time before this additional supply may meaningfully eases price pressures. Even among homebuilders, confidence remains fragile. The NAHB/Wells Fargo Housing Market Index, which tracks homebuilder sentiment, dropped from 38 to 34 in April. From a market standpoint, the homebuilding subindustry within the S&P 500 index has been roughly flat on the year, posting a gain of just 0.4% (as of the most recent available data) following several years of mixed results.
Despite these headwinds, home prices across the country have generally remained near record levels in many regions). The S&P Cotality Case-Shiller indices, which track prices nationally and across major U.S. cities, have climbed steadily over time. Nationally, meaningful price declines have only occurred in two recent episodes: the 2008 housing bust and the brief correction that followed the sharp rise in inflation beginning in 2022.
Elevated home prices have generally kept homeowner balance sheets in solid shape from a macroeconomic standpoint. This has been reinforced by a low unemployment rate and strong wage growth — key factors that have helped sustain consumer spending at levels stronger than many had anticipated. These tailwinds have helped counterbalance weaker consumer sentiment stemming from inflation pressures and job losses in certain sectors, such as technology.
Real estate serves as a cornerstone of wealth across generations
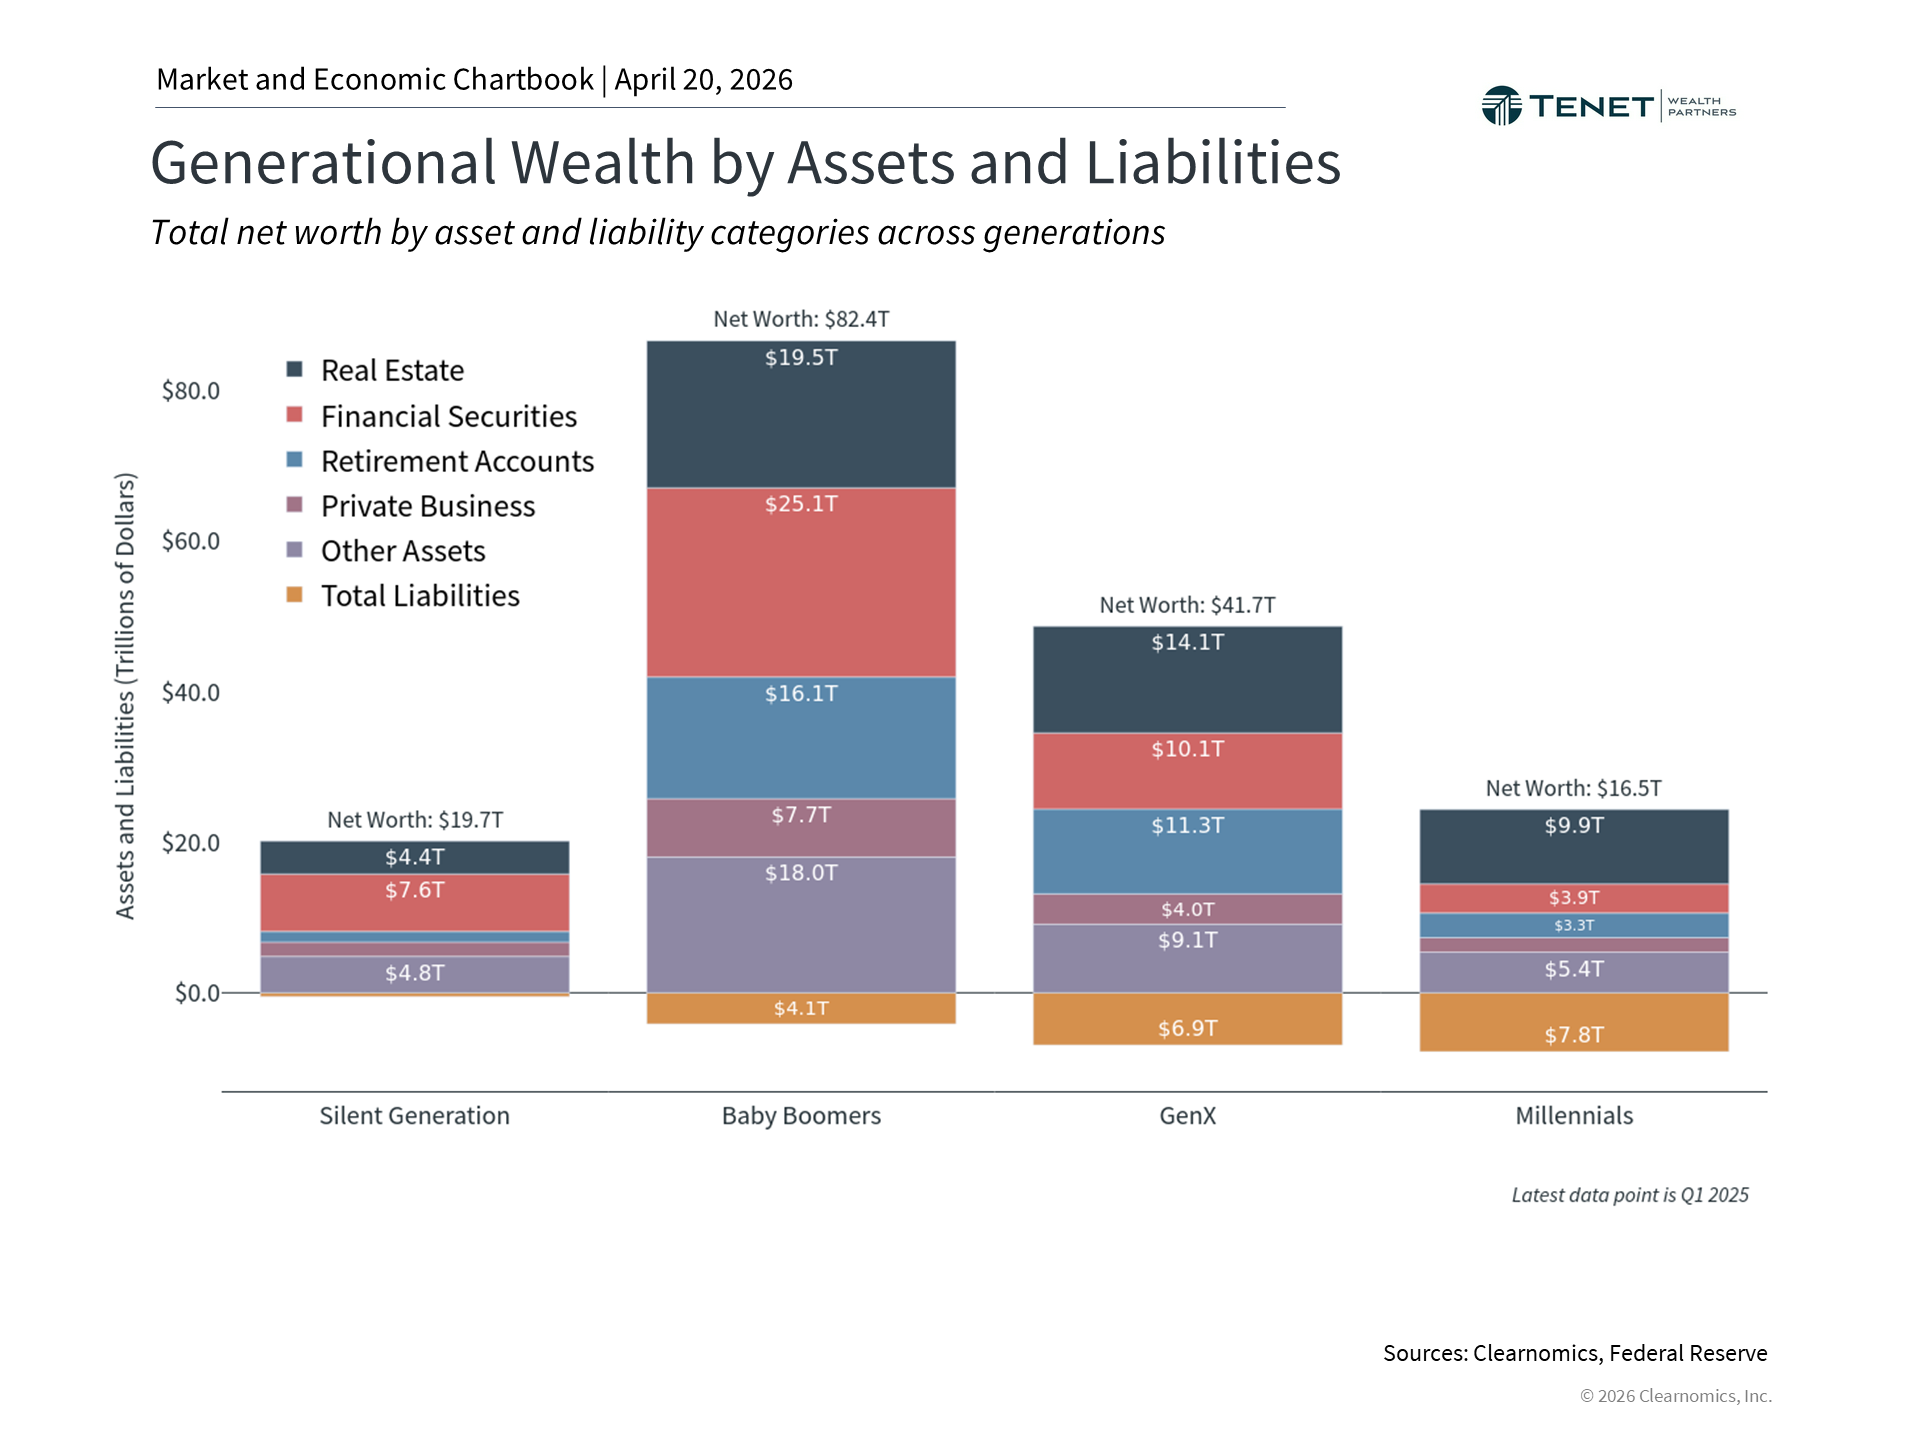 |
As illustrated in the chart above, real estate plays a big role in household net worth across all age groups. For older Americans, real estate holdings often account for a substantial portion of the assets built over a lifetime. Baby Boomers, for example, hold over $19.5 trillion in real estate, representing roughly 24% of their total net worth. For Gen X and Millennials, that proportion rises to approximately 34% and 60%, respectively. It is worth noting that real estate also represents a significant source of outstanding debt for younger households that have not yet had the opportunity to pay down their mortgages or benefit from decades of housing market appreciation.
This “wealth effect” carries particular significance during periods of stock market volatility and broader economic uncertainty. When home values rise, homeowners may feel more financially secure and in some cases may be more inclined to spend on goods and services, thereby supporting wider economic growth. This sense of financial well-being can persist even when homeowners do not actively tap into their home equity through instruments such as a reverse mortgage or home equity line of credit.
This dynamic also underscores the value of taking a holistic approach to financial planning. Short-term stock market fluctuations, while uncomfortable, may have a smaller impact on an investor’s overall financial picture than initially perceived, given that a significant portion of wealth is often tied to other assets. In fact, depending on an investor’s individual circumstances, addressing mortgage obligations and other forms of debt may, in certain cases, be a higher priority than reacting to stock market movements.
These financial and psychological dynamics make the housing market a critical variable — both as an economic indicator and as a factor in personal financial planning. Housing costs also directly influence inflation, as they are the primary driver of the “shelter” category within the Consumer Price Index. Even prior to energy prices contributing to the most recent uptick in headline inflation, persistently elevated shelter costs have been a key reason that inflation has been slow to return to the Fed’s 2% target.
Household debt reflects both mortgage obligations and consumer borrowing
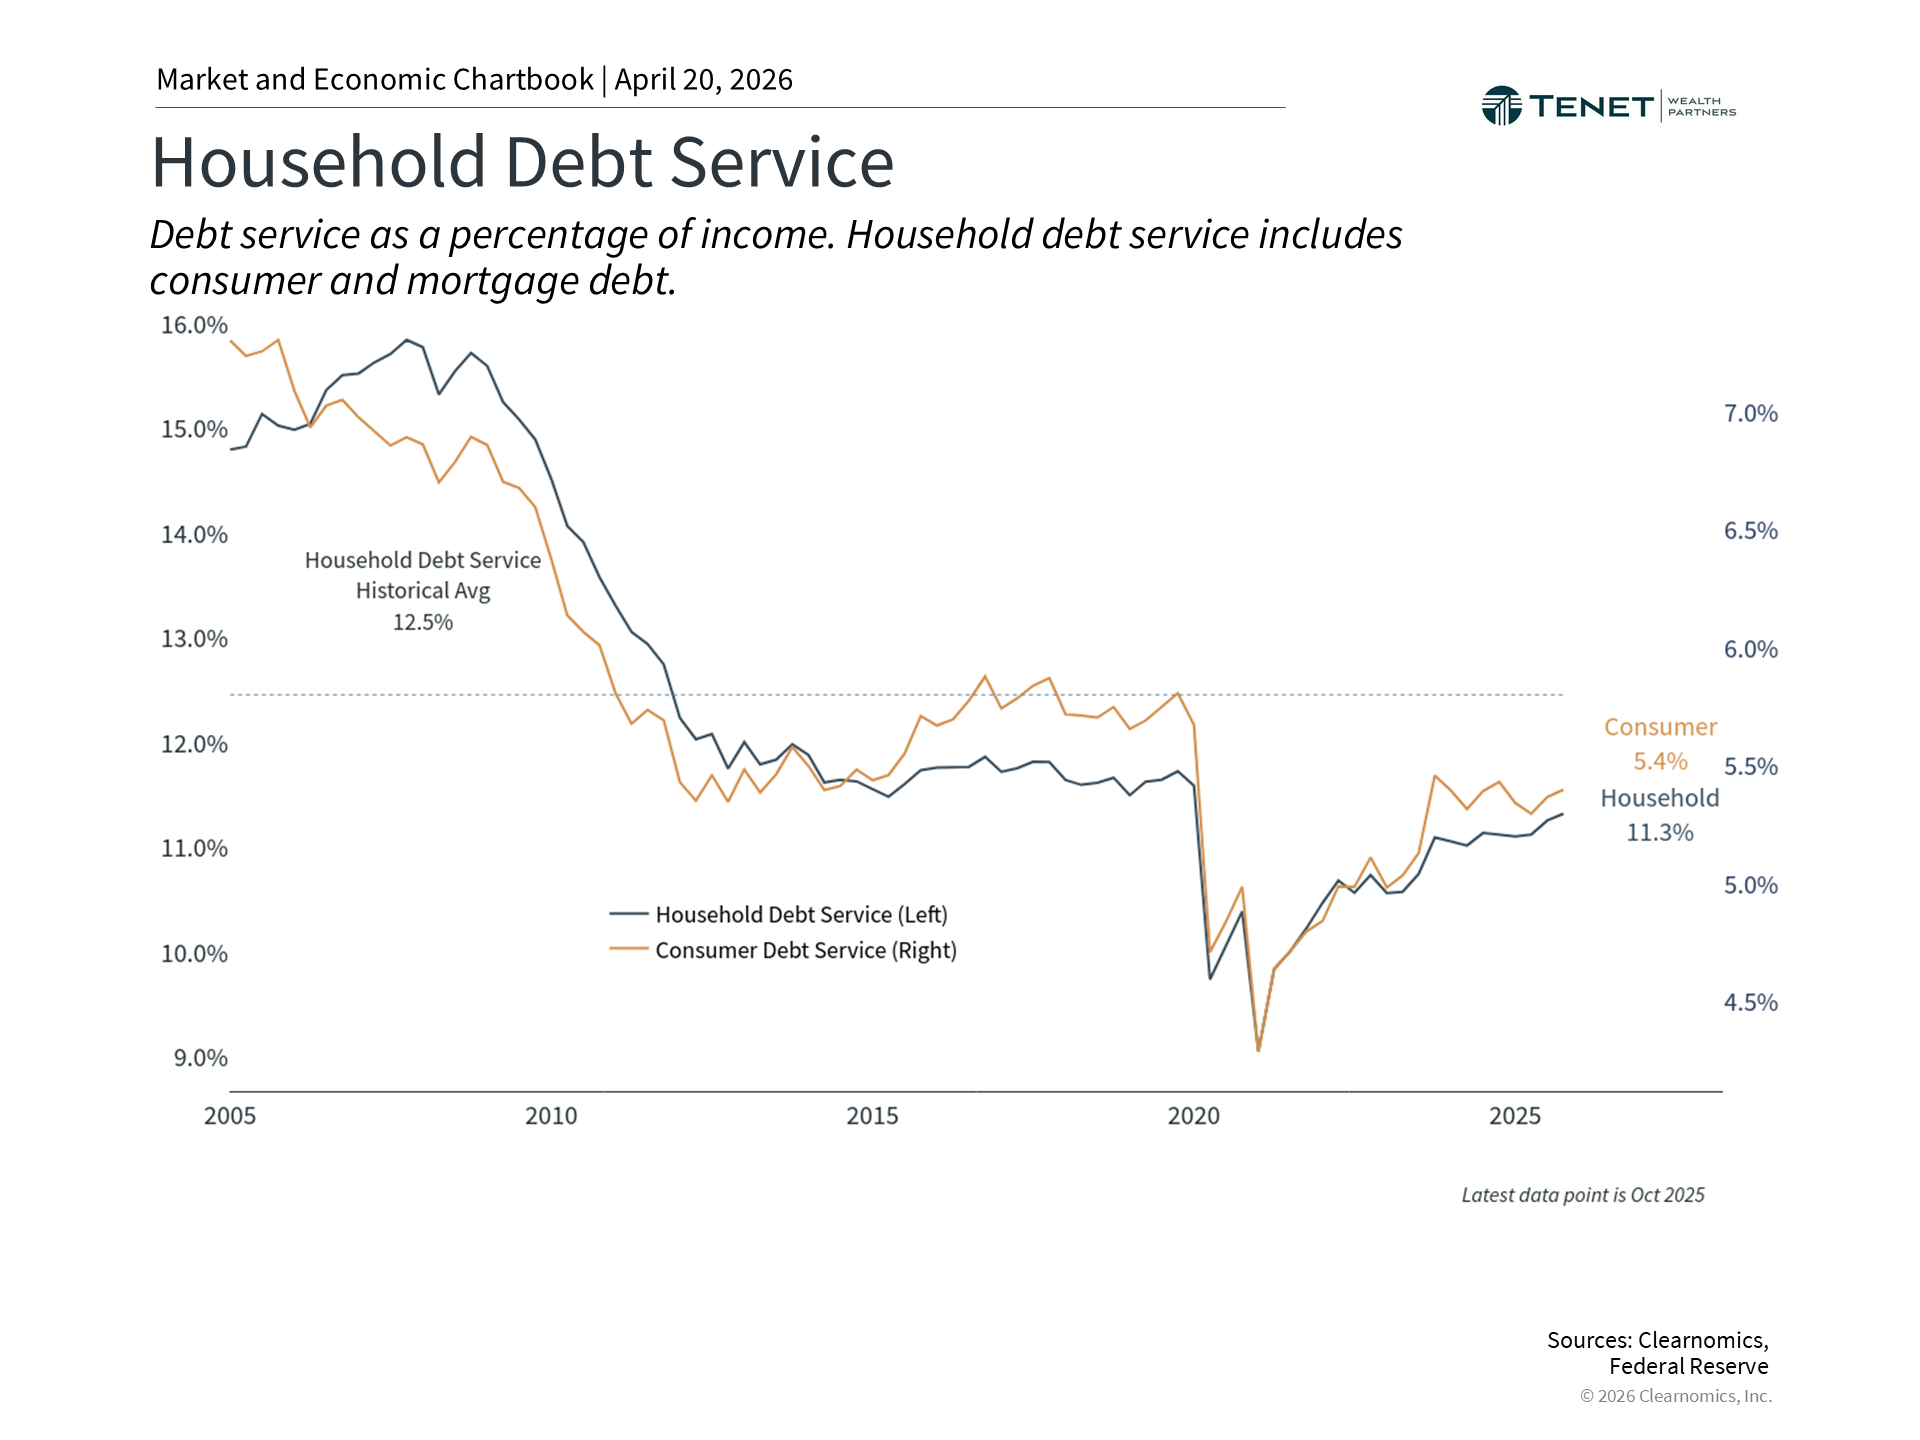 |
Housing is not only commonly the largest asset on most household balance sheets — it is also usually the largest source of debt. The accompanying chart above illustrates both total household debt (which includes mortgages) and consumer debt (which does not). Even as other forms of borrowing — including credit card balances and student loans — continue to grow, mortgage debt remains by far the dominant component of total household obligations.
One positive aspect of the current environment is that debt service levels — the ratio of debt payments to household income — remain moderate by historical standards. Mortgage underwriting standards have also become considerably more rigorous since the 2008 financial crisis, a period when household debt levels were substantially higher. That said, the weight of these debt payments remains a real consideration for many households, particularly those who purchased homes more recently at elevated prices and higher interest rates.
From an economic standpoint, healthy home prices may continue to underpin consumer balance sheets and the broader economy, even as housing activity remains mixed. From a financial planning perspective, it is essential for investors to have a comprehensive understanding of their complete financial picture. While market headlines have been dominated by stock market volatility and geopolitical developments, the reality is that focusing on elements of financial plans closer to home may have a meaningful impact on achieving long-term goals.
Overall, the housing market remains a core part of both household finances and the broader economy. With ongoing market volatility, understanding the key drivers of household wealth can help investors maintain perspective and stay focused on their long-term financial plans.
Build a More Thoughtful Investment Strategy
We believe a well-structured financial plan may help align your portfolio with your goals, risk tolerance, and long-term priorities.
No pressure. Just a conversation about your financial plan.
Investment advisory services offered through Tenet Wealth Partners, LLC, a registered investment advisor with the U.S. Securities and Exchange Commission. This material is intended for informational purposes only. It should not be construed as legal or tax advice and is not intended to replace the advice of a qualified attorney or tax advisor. This information is not an offer or a solicitation to buy or sell securities. The information contained may have been compiled from third-party sources and is believed to be reliable.
The information provided in this communication was sourced by Tenet Wealth Partners through public information and public channels and is in no way proprietary to Tenet Wealth Partners, nor is the information provided Tenet Wealth Partner’s position, recommendation or investment advice. Certain statements contained herein may constitute forward-looking statements, which are based on current expectations and subject to change.
This material is provided for informational/educational purposes only. This material is not intended to constitute legal, tax, investment or financial advice. Investments are subject to risk, including but not limited to market and interest rate fluctuations.
Any performance data represents past performance which is no guarantee of future results. Prices/yields/figures mentioned herein are as of the date noted unless indicated otherwise. All figures subject to market fluctuation and change. Additional information available upon request. Index performance is presented for illustrative purposes only and does not represent the performance of any specific investment product or portfolio. An investment cannot be made directly into an index.

About The Author
Kevan Melchiorre, CFP®Co-Founder & Managing Partner
Kevan Melchiorre co-founded Tenet Wealth Partners in 2021 with a focus on delivering a premier client experience, supported by an innovative and fully integrated approach to wealth planning. As a CERTIFIED FINANCIAL PLANNER® practitioner with over 18 years of wealth management experience, Kevan partners with affluent individuals, families, and institutions to help align their capital […]
Learn more about Kevan