This Q1 2026 market update reviews key trends shaping the economy, including stock market performance, oil price volatility, and shifting economic conditions. While short-term uncertainty has increased, understanding these developments can help investors stay focused on long-term goals.
Q1 2026 Market Update Summary
- Markets experienced a modest pullback in Q1 due to geopolitical tensions.
- Oil prices surged, creating pressure on inflation and consumer costs.
- Economic growth is slowing, but the broader economy remains stable.
- Sector performance has diverged, reinforcing the importance of diversification.
The first quarter of 2026 underscores just how important preparation is for long-term financial planning and investing. Following strong gains in 2025, markets encountered a combination of geopolitical shocks, elevated oil prices, and renewed economic uncertainty. The conflict in Iran, which began in late February, dominated market headlines, pushing oil prices sharply higher and triggering the year’s first notable pullback. By the end of March, reports of a potential ceasefire began to surface, and the situation remains fluid.
Despite these headwinds, markets have delivered strong performance over the trailing twelve months, with energy and defensive sectors providing meaningful support to diversified portfolios. Looking ahead, new questions are likely to emerge, including a leadership transition at the Federal Reserve and the midterm election later in the year. For long-term investors, Q1 2026 is a timely reminder that markets rarely rise in a straight line, and that sound investing principles matter most when uncertainty is highest.
Key Market and Economic Drivers
• The S&P 500 experienced a total return of -4.3% in Q1, the Nasdaq -7.0%, and the Dow Jones Industrial Average -3.2%.
• The Bloomberg U.S. Aggregate Bond Index was flat for the first quarter of 2026. The 10-year Treasury yield ended the quarter at 4.3% after falling as low as 3.9% at the end of February.
• Developed market international stocks (MSCI EAFE) were down -1.1% and emerging market stocks (MSCI EM) declined -0.1% over the quarter, both on a total return basis in U.S. dollar terms.
• Oil prices spiked with Brent crude reaching $118 per barrel at the end of March after beginning the year under $61. WTI ended the quarter at $101 per barrel.
• Gold ended the quarter at $4,668 per ounce after climbing as high as $5,417 in January. The U.S. Dollar Index (DXY) strengthened slightly to 99.96 over the same period.
• February inflation showed headline CPI rising 2.4% year-over-year and core CPI climbing 2.5%. The core PCE price index, the Fed’s preferred measure, rose 3.1% year-over-year in January.
• The Federal Reserve kept rates unchanged within a range of 3.50% to 3.75% at both meetings during the first quarter.
Markets experienced the first pullback of the year
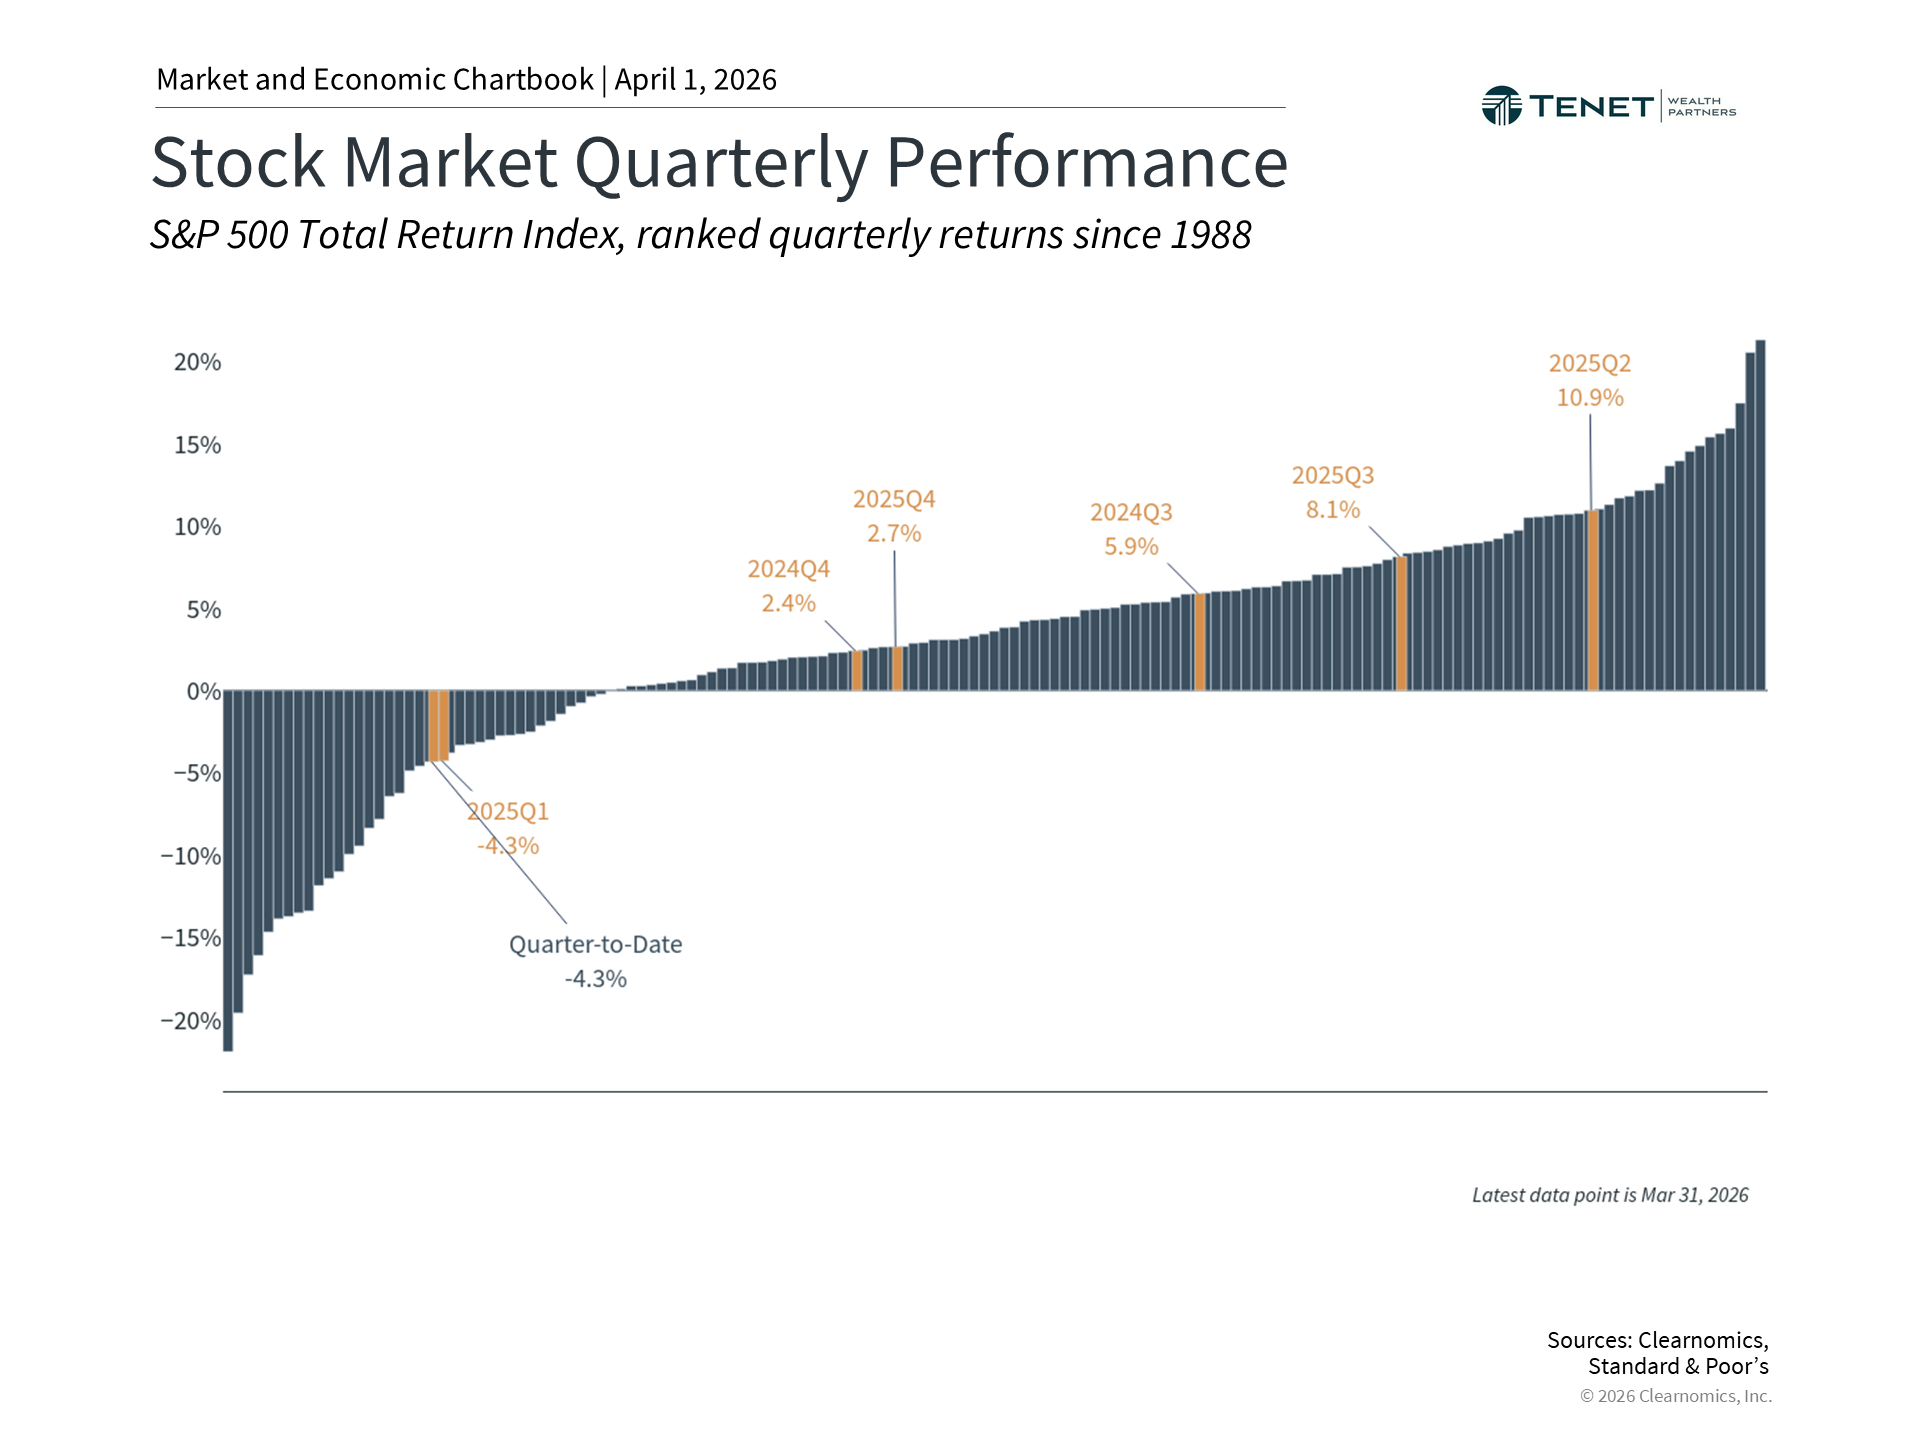 |
There are notable parallels between the start of 2026 and the beginning of 2025, as both were marked by global concerns and an S&P 500 pullback of exactly 4.3% in the first quarter. Last year’s volatility was driven by tariffs, while this year’s stems from conflict in the Middle East — yet the effect on investor sentiment has been strikingly similar. When uncertainty rises, short-term market swings in response to headlines are a natural occurrence.
A broader historical view offers helpful context. Despite the turbulence of Q1 2025, the stock market went on to achieve strong gains throughout the remainder of the year, including dozens of record highs. The broader point is not that markets always rebound quickly, but that recoveries often happen when investors least expect them. Since 1980, the S&P 500 has averaged an intra-year drawdown of around 15%, yet markets have posted positive returns in more than two-thirds of calendar years. Last year saw six pullbacks of 5% or more, even as the S&P 500 finished with an 18% total return.
For long-term investors, the key takeaway is that short-term volatility driven by headline risk is a normal part of the market cycle. Portfolios aligned with long-term financial goals are built to navigate exactly these kinds of periods.
Geopolitics and oil prices are the primary source of uncertainty
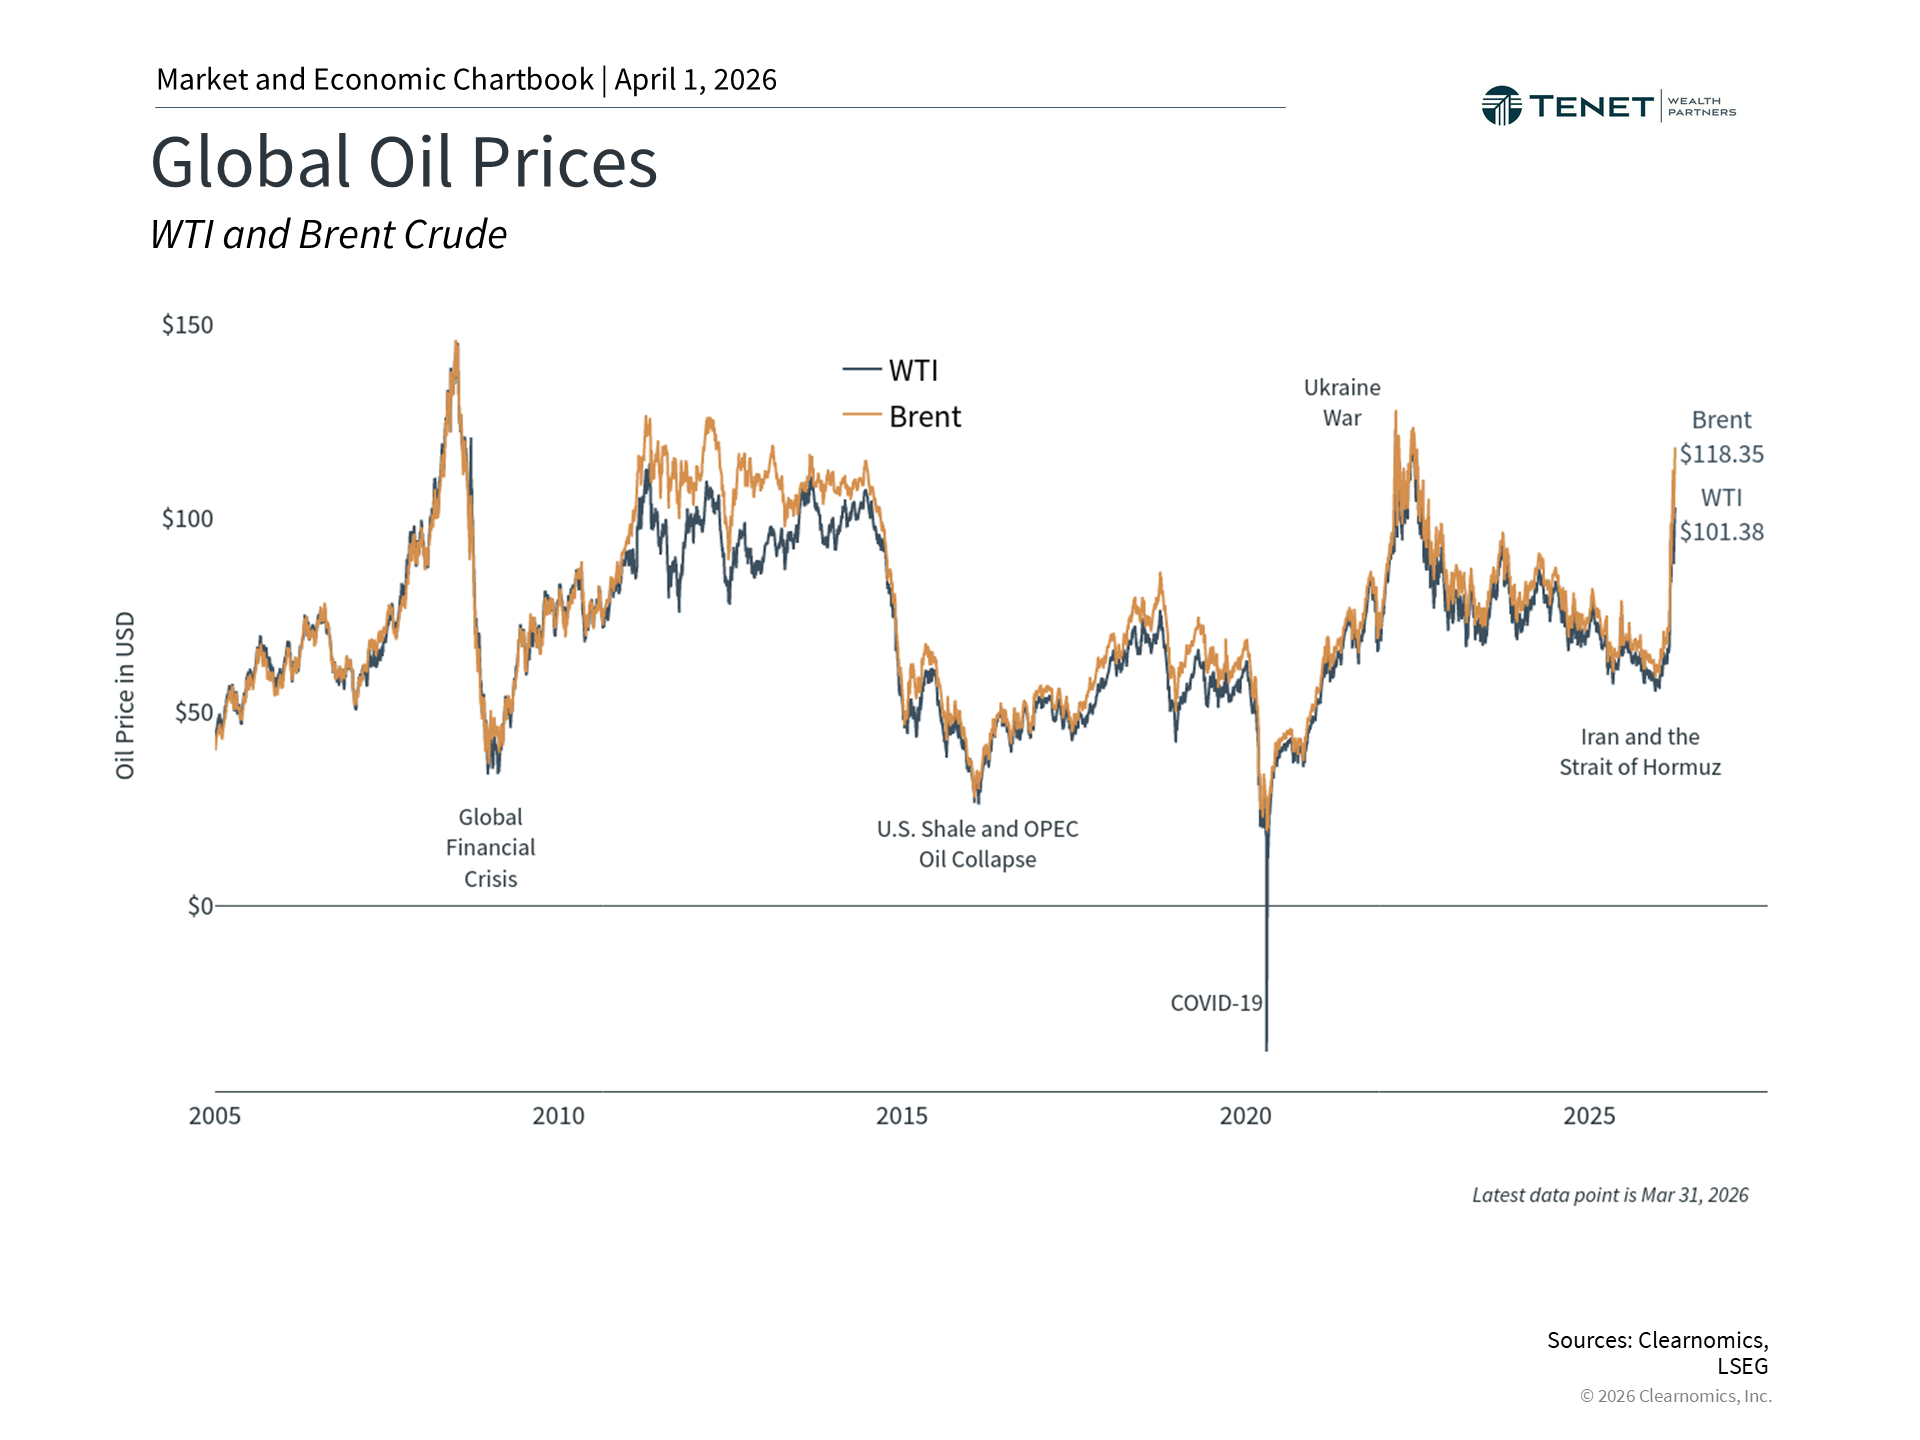 |
The most consequential market development of the first quarter was the escalating conflict in the Middle East, which drove a sharp rise in oil prices. Disruptions to the Strait of Hormuz, which carries roughly 20% of global oil from the Persian Gulf to the rest of the world, led to production cuts across major regional oil-producing nations. Brent crude ended the quarter at $118 per barrel, up over 94% year-to-date, while WTI surpassed $100 — the highest levels since the war in Ukraine began in 2022.
Higher fuel costs affect consumers directly through gasoline prices and indirectly by raising the cost of goods and services. The national average price of gasoline reached $4 at the end of March. While this creates real pressure on household budgets, economists generally view these “supply-side shocks” as temporary, as oil prices tend to stabilize once the underlying geopolitical situation resolves — as was the case in 2022 when gas prices reached $5 before declining within months.
History also shows that geopolitical events, while unsettling in the short term, have not typically derailed markets over the long run. Investors who made dramatic portfolio changes in response to past geopolitical events often did so at the wrong moment.
Economic growth is slowing but remains positive
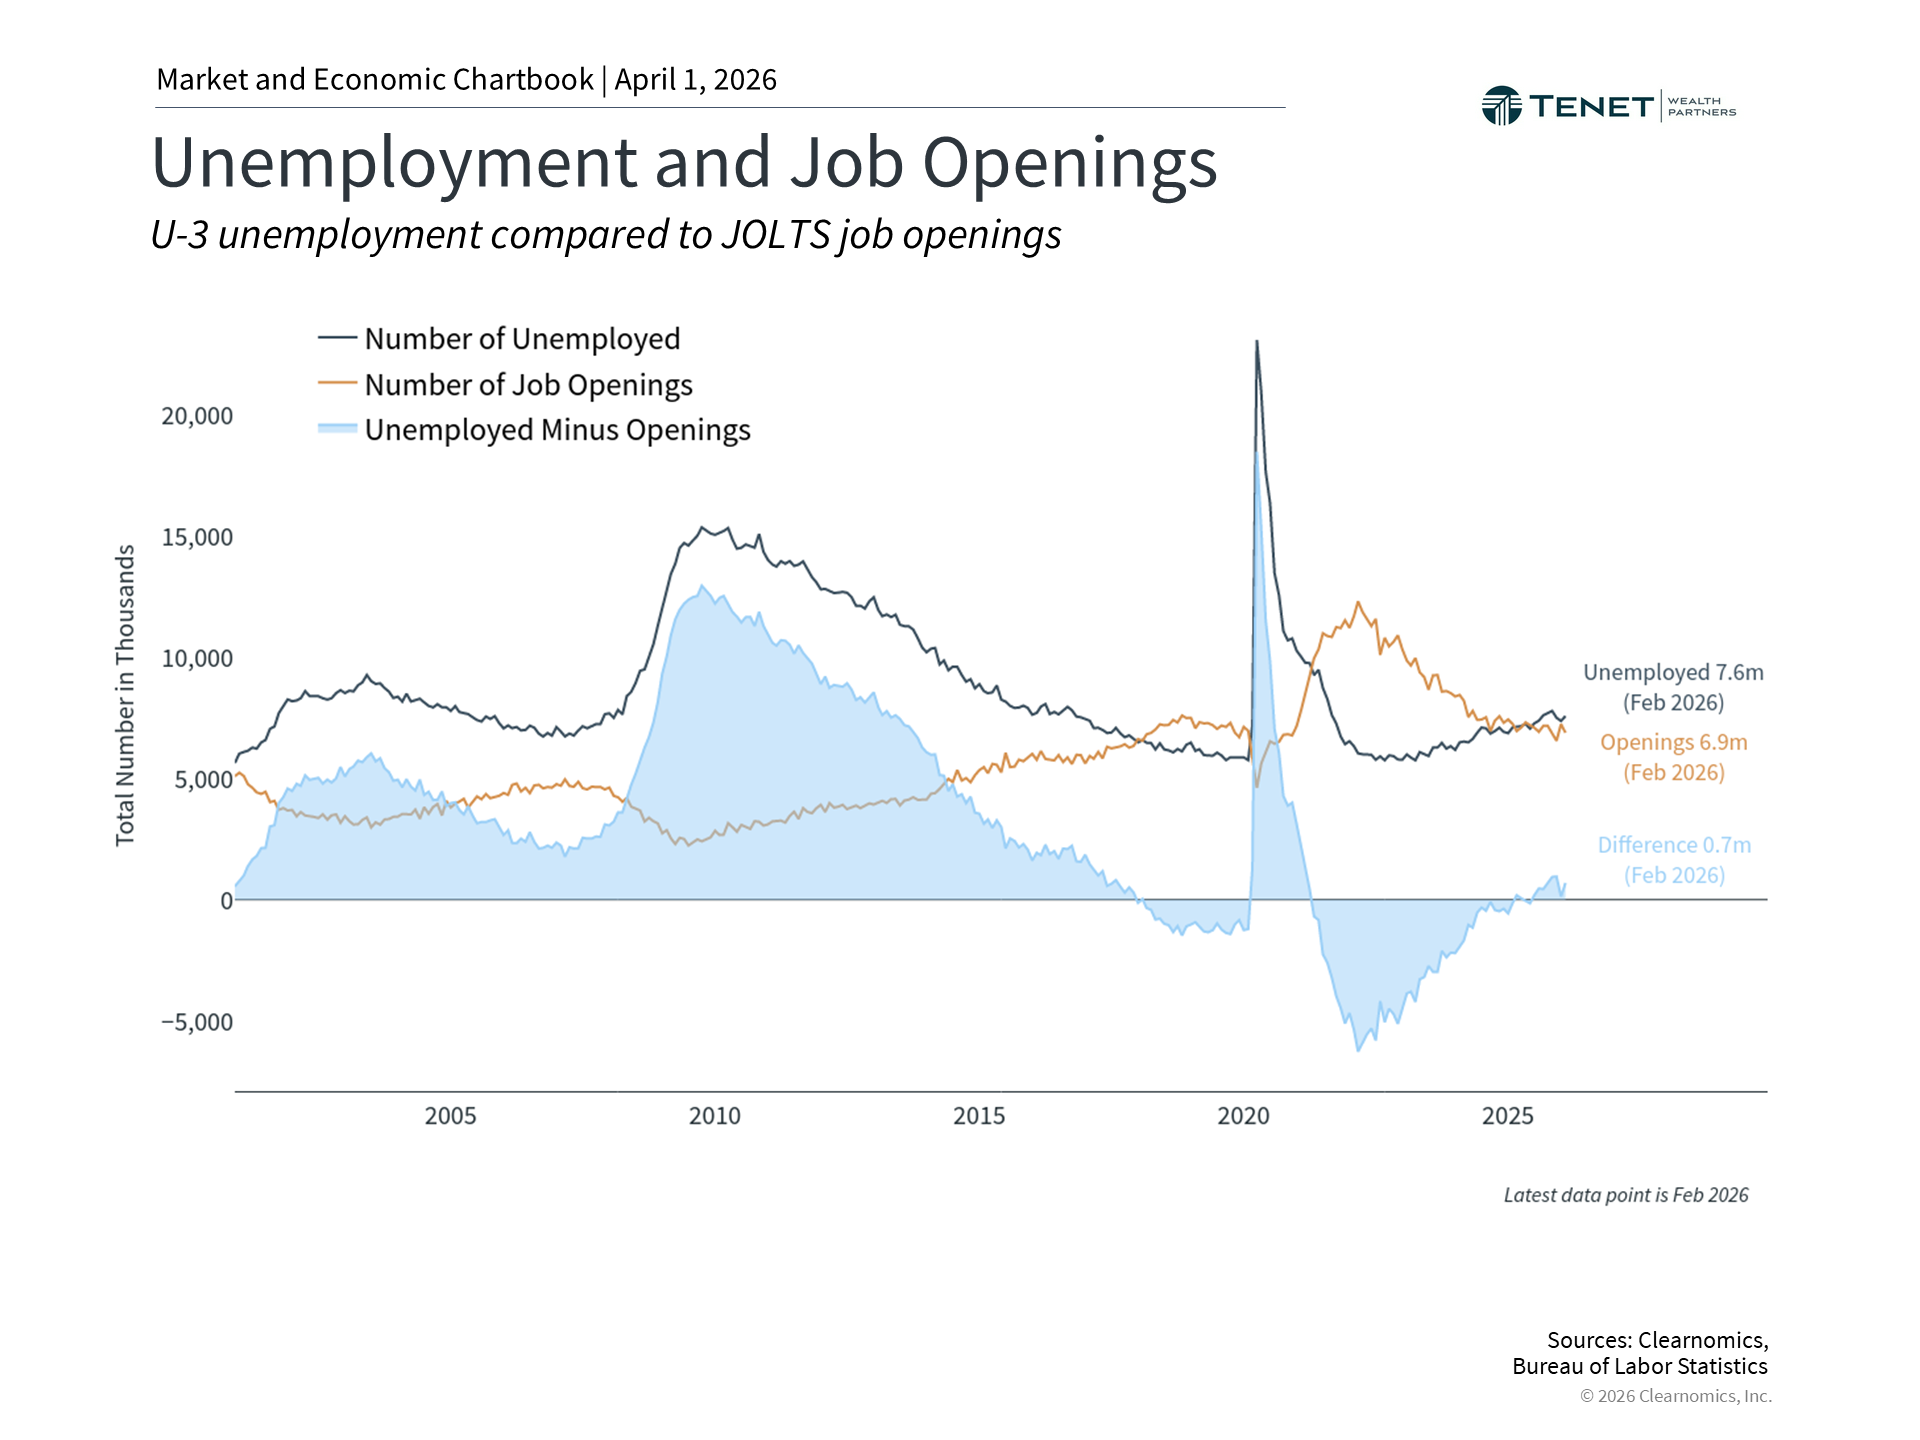 |
Beyond energy prices, the broader economy has cooled over the past year but remains fundamentally healthy. The labor market, one of the most closely watched indicators, showed that February job gains fell by 92,000 and the unemployment rate edged up to 4.4%. Job seekers now outnumber job openings for the first time in years — a notable shift from 2022, when there were two job openings for every unemployed individual. That said, lower immigration and an aging population are also constraining labor supply, which has helped keep unemployment near historically low levels. Consumer spending, which accounts for more than two-thirds of GDP, has remained stronger than many expected.
Sector performance has diverged
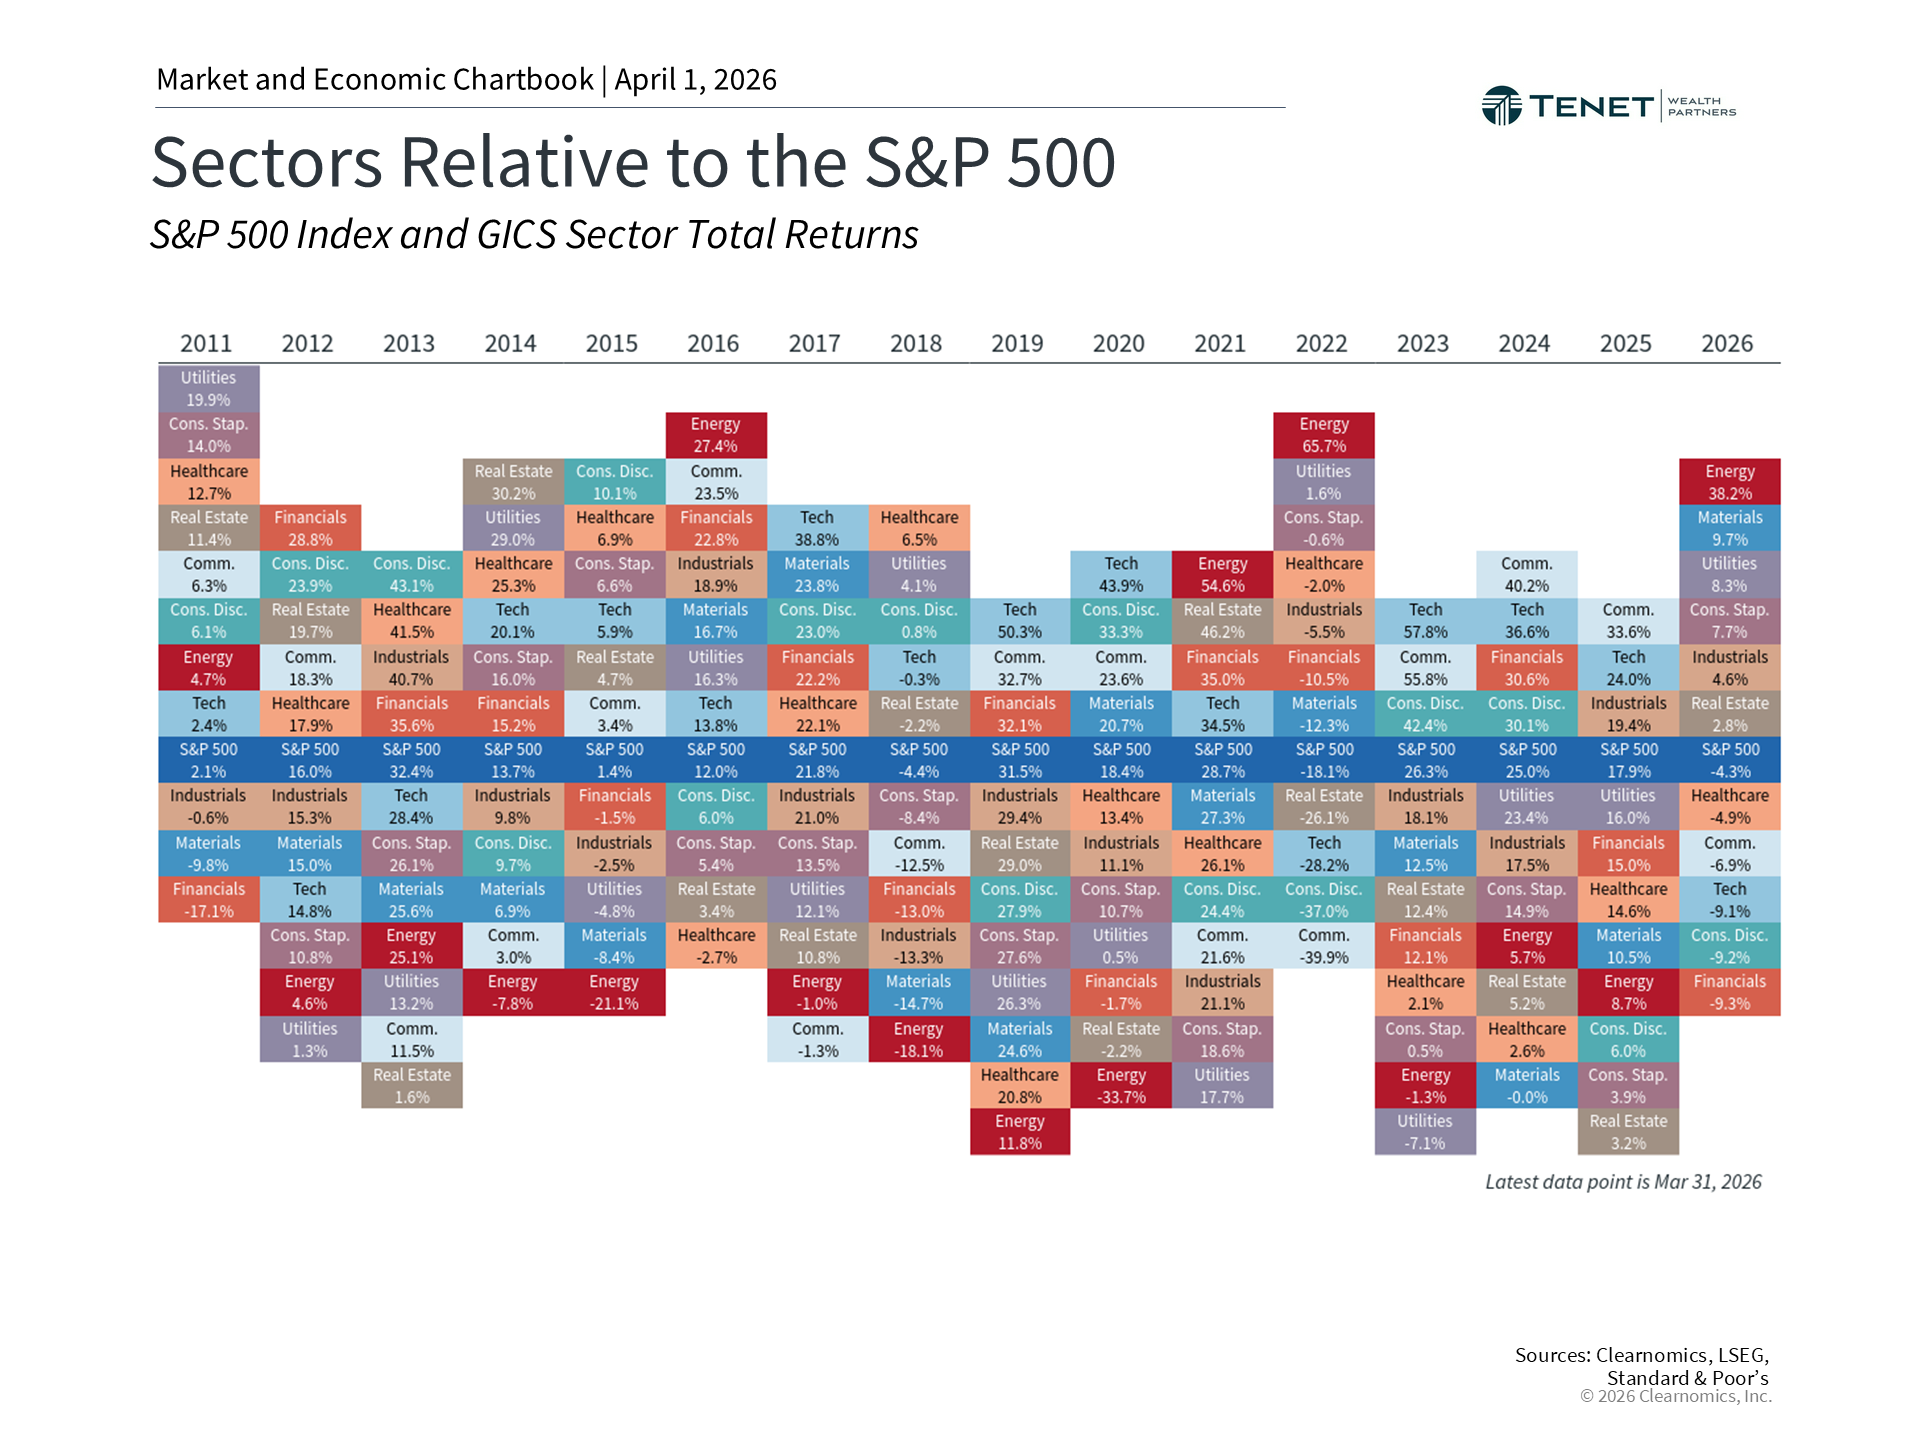 |
Despite the overall market pullback, sector-level performance has varied widely. Six of eleven S&P 500 sectors were positive for the year through the end of Q1, and the gap between the best and worst performing sectors widened to nearly 50 percentage points. Energy led all sectors with a gain of nearly 40%, driven by surging oil prices. Consumer Staples, Utilities, Materials, and Industrials also showed strength, benefiting from a more cautious market environment. In contrast, Information Technology declined approximately 9%, with many Magnificent 7 stocks underperforming — a notable shift from recent years when a handful of large technology companies drove the majority of market gains.
Sector leadership has historically rotated based on market and economic conditions. Energy led in 2021 and 2022, then lagged for the following three years. Because predicting which sector will lead in any given year is extremely difficult, a well-diversified portfolio remains better positioned to weather varying market environments.
The tariff story is evolving
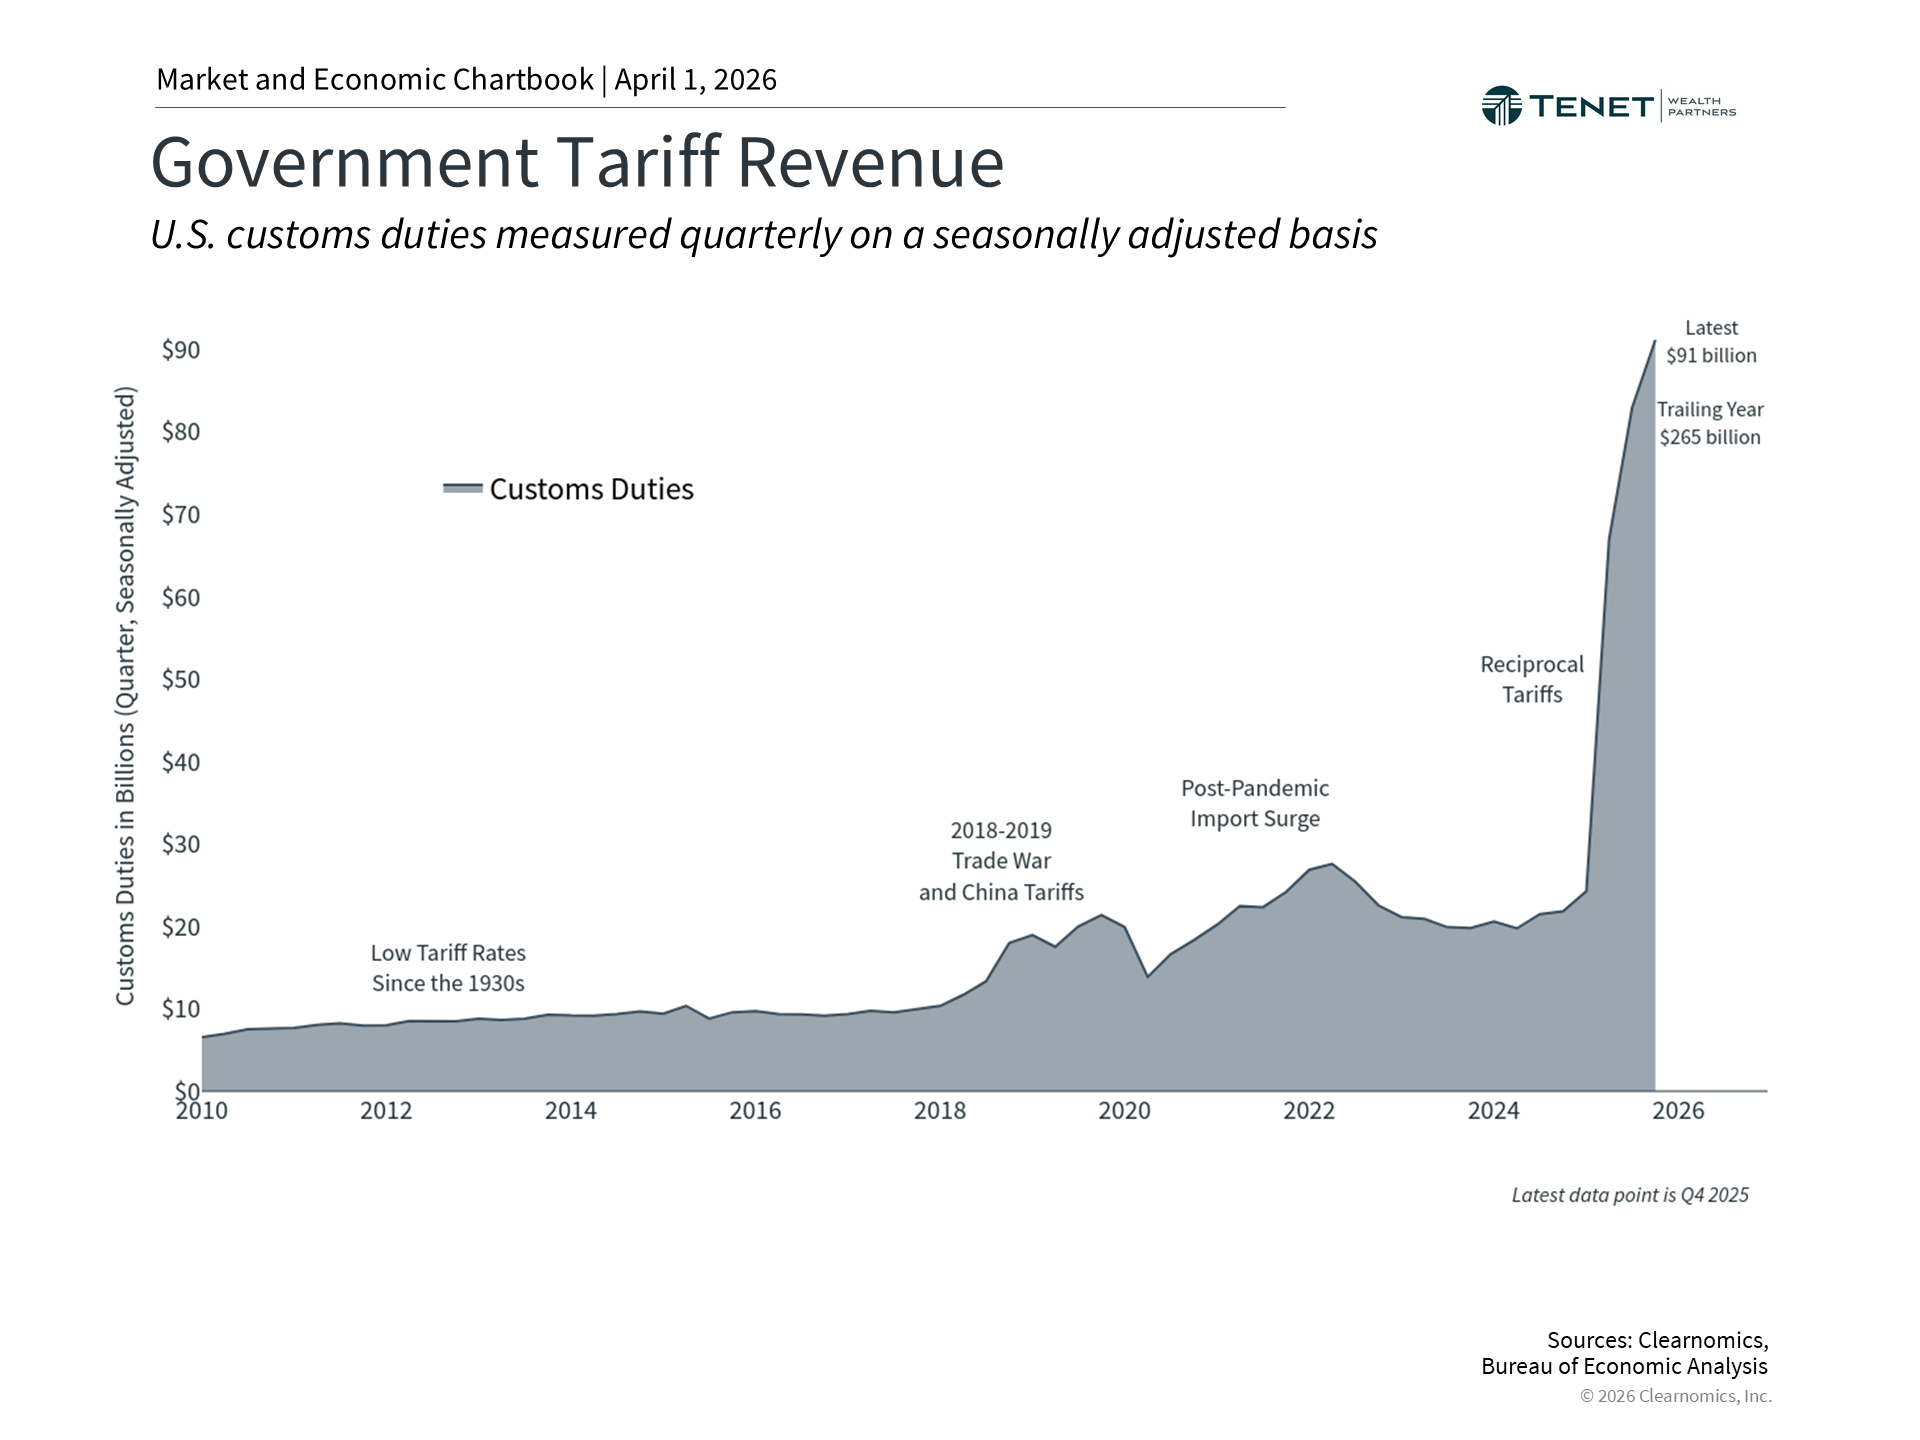 |
Trade policy shifted at the end of January after the Supreme Court ruled 6-3 that broad tariffs imposed under the International Emergency Economic Powers Act (IEEPA) were unlawful. In response, the administration imposed a temporary global import duty under Section 122 of the Trade Act of 1974, and also opened new Section 301 trade investigations in March, with about a dozen Section 232 investigations still ongoing. While the legal framework has changed, the broader policy direction remains intact. Tariffs will likely continue to influence consumer prices, business costs, and investor confidence. As 2025 demonstrated, however, markets have the capacity to adapt to policy changes over time.
The bottom line? The first quarter of 2026 challenges investors with geopolitical shocks, higher oil prices, and economic uncertainty. Yet markets have been resilient, with well-balanced portfolios and financial plans doing what they were designed to do. Investors should continue to focus on long run goals in the coming months.
Stay Focused in Changing Markets
A well-structured financial plan can help you navigate uncertainty and stay aligned with your long-term goals.
No pressure. Just a conversation about your financial plan.
Investment advisory services offered through Tenet Wealth Partners, LLC, a registered investment advisor with the U.S. Securities and Exchange Commission. This material is intended for informational purposes only. It should not be construed as legal or tax advice and is not intended to replace the advice of a qualified attorney or tax advisor. This information is not an offer or a solicitation to buy or sell securities. The information contained may have been compiled from third-party sources and is believed to be reliable.
The information provided in this communication was sourced by Tenet Wealth Partners through public information and public channels and is in no way proprietary to Tenet Wealth Partners, nor is the information provided Tenet Wealth Partner’s position, recommendation or investment advice. Certain statements contained herein may constitute forward-looking statements, which are based on current expectations and subject to change.
This material is provided for informational/educational purposes only. This material is not intended to constitute legal, tax, investment or financial advice. Investments are subject to risk, including but not limited to market and interest rate fluctuations.
Any performance data represents past performance which is no guarantee of future results. Prices/yields/figures mentioned herein are as of the date noted unless indicated otherwise. All figures subject to market fluctuation and change. Additional information available upon request.
Copyright (c) 2026 Clearnomics, Inc. All rights reserved. The information contained herein has been obtained from sources believed to be reliable, but is not necessarily complete and its accuracy cannot be guaranteed. No representation or warranty, express or implied, is made as to the fairness, accuracy, completeness, or correctness of the information and opinions contained herein. The views and the other information provided are subject to change without notice. All reports posted on or via www.clearnomics.com or any affiliated websites, applications, or services are issued without regard to the specific investment objectives, financial situation, or particular needs of any specific recipient and are not to be construed as a solicitation or an offer to buy or sell any securities or related financial instruments. Past performance is not necessarily a guide to future results. Company fundamentals and earnings may be mentioned occasionally, but should not be construed as a recommendation to buy, sell, or hold the company’s stock. Predictions, forecasts, and estimates for any and all markets should not be construed as recommendations to buy, sell, or hold any security–including mutual funds, futures contracts, and exchange traded funds, or any similar instruments. The text, images, and other materials contained or displayed in this report are proprietary to Clearnomics, Inc. and constitute valuable intellectual property. All unauthorized reproduction or other use of material from Clearnomics, Inc. shall be deemed willful infringement(s) of this copyright and other proprietary and intellectual property rights, including but not limited to, rights of privacy. Clearnomics, Inc. expressly reserves all rights in connection with its intellectual property, including without limitation the right to block the transfer of its products and services and/or to track usage thereof, through electronic tracking technology, and all other lawful means, now known or hereafter devised. Clearnomics, Inc. reserves the right, without further notice, to pursue to the fullest extent allowed by the law any and all criminal and civil remedies for the violation of its rights. Index performance is presented for illustrative purposes only and does not represent the performance of any specific investment product or portfolio. An investment cannot be made directly into an index.
About The Author
Kevan Melchiorre, CFP®Co-Founder & Managing Partner
Kevan Melchiorre co-founded Tenet Wealth Partners in 2021 with a focus on delivering a premier client experience, supported by an innovative and fully integrated approach to wealth planning. As a CERTIFIED FINANCIAL PLANNER® practitioner with over 18 years of wealth management experience, Kevan partners with affluent individuals, families, and institutions to help align their capital […]
Learn more about Kevan