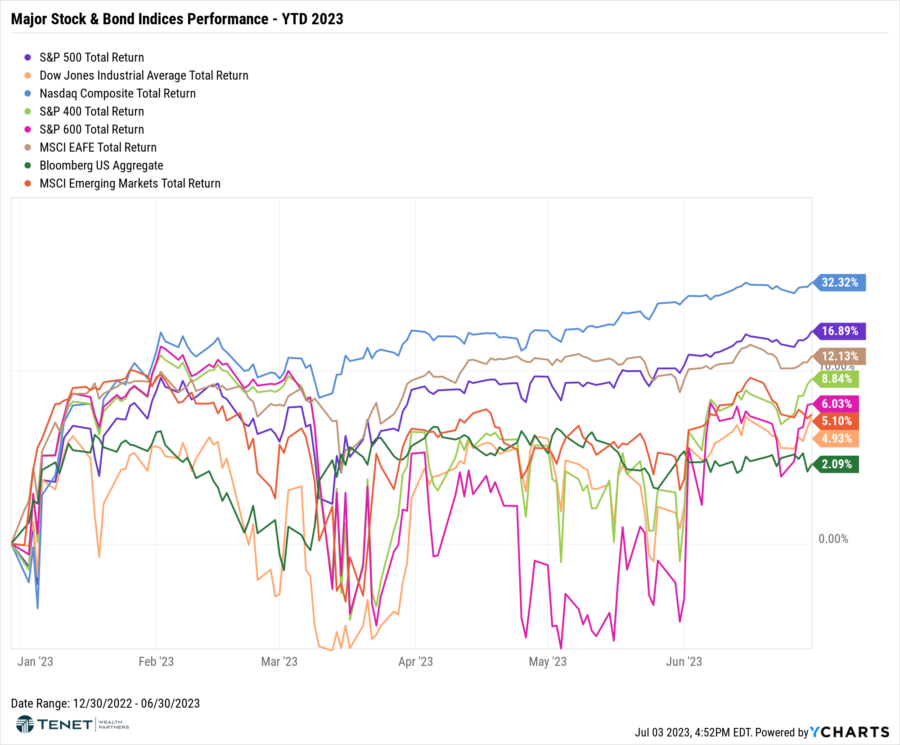
Major Index Returns – Q1 2023
Markets roared higher in the 2nd quarter and ended the first half of the year with excellent returns overall. Most of the performance has been driven by inflation that is cooling faster than expected, strong jobs data, and better than expected corporate earnings. Resiliency of consumers, both from a spending and income perspective, has also helped returns.
Tech stocks have led the pack, mainly driven by the largest names in the Nasdaq and S&P (Apple, Microsoft, Amazon, Tesla, NVIDIA, etc.), which illustrates that the rally has been very top-heavy thus far. Developed International stocks (MSCI EAFE) have also continued to deliver strong, double-digit returns given resilient corporate profits and a falling US dollar.
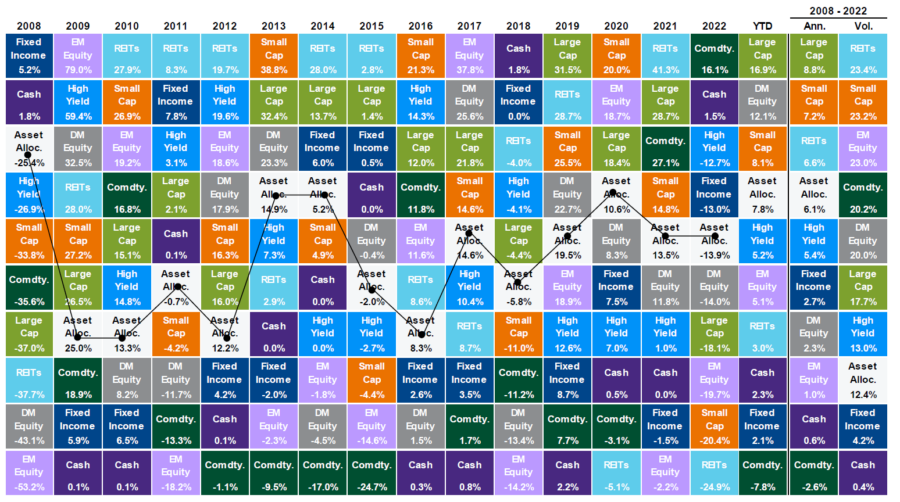
60/40 Resurgence & Strong Performance
For investors in diversified portfolios of stocks and bonds, we have seen a resurgence this year from a performance perspective following a dismal 2022. A sample 60% stock and 40% bond mix (represented by the light gray “Asset Alloc.” boxes in the below chart) was up nearly 8% at the end of June and in the top half of returning asset classes.
Key Risks We are Watching in the Second Half of 2023
- Core Inflation & The Fed – More Rate Hikes Ahead?
- Slowing Growth – Lower Corporate Earnings + Tighter Credit Conditions & Labor Markets
- Recession or Slowdown on the Horizon?
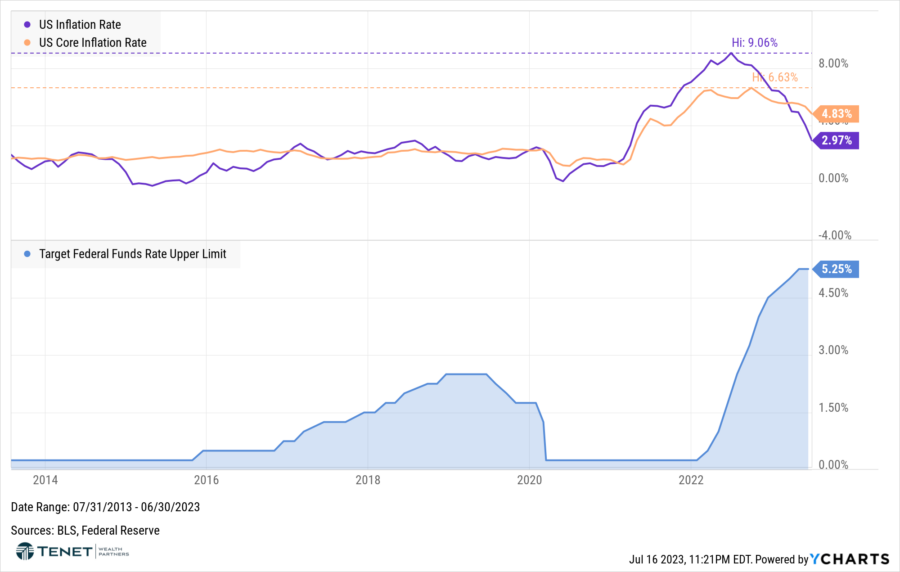
Inflation – Core Not Falling as Fast as Headline
- Headline inflation has plummeted this year, now down to 3%, but core inflation has remained steadier at 4.8%. Core inflation excludes more volatile food and energy prices and tends to provide a more accurate measure of where inflation is headed.
- The Fed keeps a closer eye on Core inflation and wants to see this number drop further to get more comfortable with stopping rate hikes.
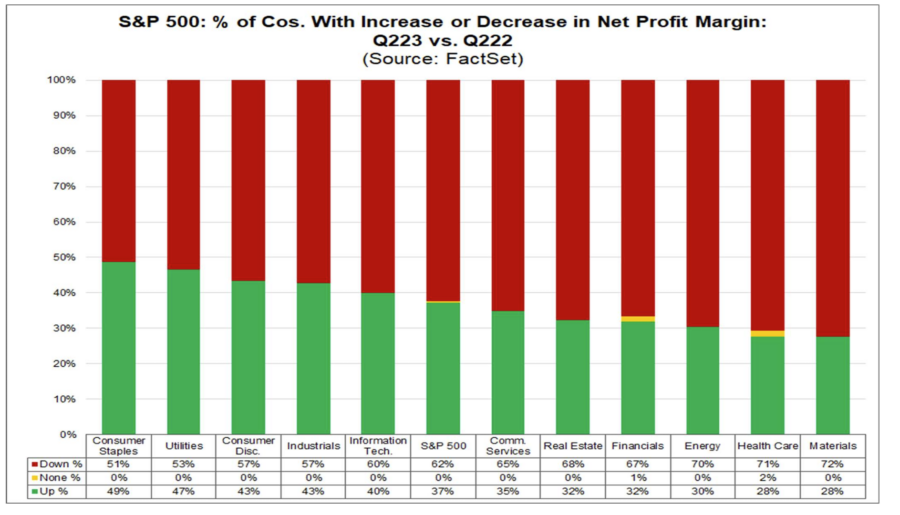
Declining Earnings, Guidance, and Profit Margins
- For Q2 2023, the blended earnings decline for the S&P 500 is –projected to be 7.1%, which would be largest decline since Q2 2020 (-31.6%).
- 60% of S&P 500 companies have issued NEGATIVE guidance for Q2 2023.
- 6 of 11 S&P 500 sectors have also reported a year-over-year decrease in net profit margin.
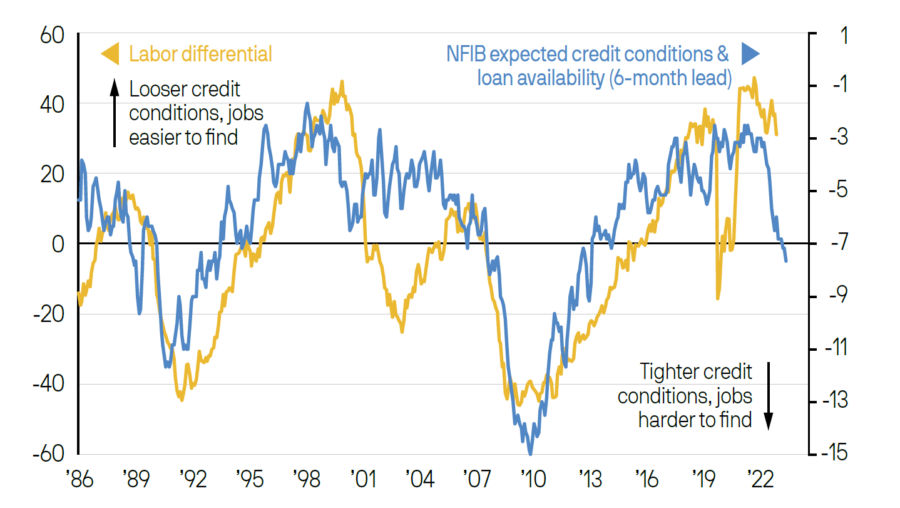
Credit Conditions & Labor Markets
- Following the stress we saw in regional banking sector in March, it is likely that credit conditions will tighten. We are already seeing signs that bank lending standards are becoming stricter.
- Tighter lending conditions may contribute to labor market weakness, impacting both businesses and consumers. The labor market is already tight with recent data showing that we have 9.8 million job openings in the U.S., but only 5.9 million unemployed workers.
U.S. Economic Outlook – Deteriorating Conditions?
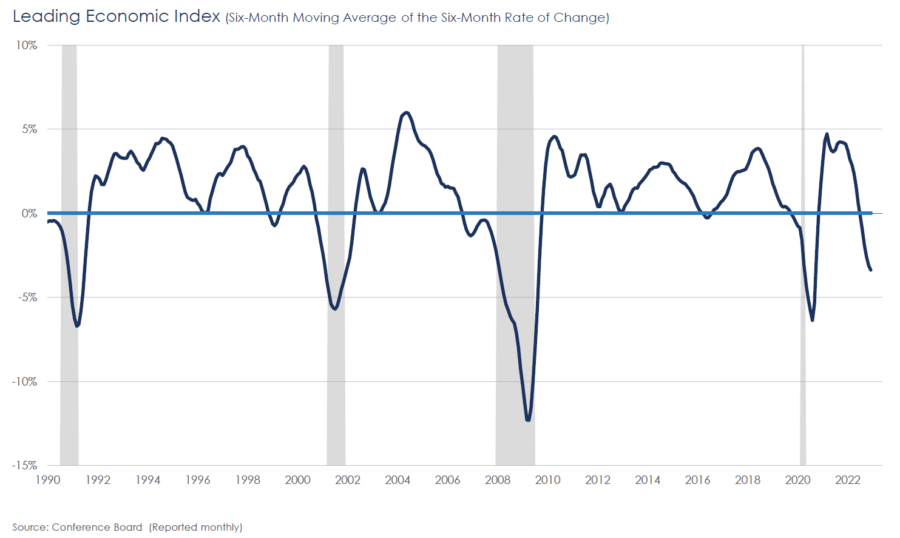
- The U.S. Leading Economic Index (LEI), which provides an early indication of significant turning points in the business cycle and where the economy is heading short term, continued to fall in May. It was the 14th consecutive month, pointing to weaker economic activity ahead.
- Consumer expectations for business conditions also continued to fall as did the ISM® New Orders Index.
- Rising interest rates paired with persistent inflation could also dampen economic activity further.
Potential Opportunities for the 2nd Half of 2023
- Investment-Grade Bonds Remain Attractive.
- High Yield Bonds – More “Gem” than “Junk”
- U.S. Small Cap Equity – Attractive, Discounted Valuations.
US Investment Grade Bond Yields Attractive: Highest Level in 10 Years
- Yields on both Government Bonds and Corporate Bonds, as well as CDs, have climbed to attractive levels
- This scenario presents investors with an opportunity to both lock in rates that pay higher income and have the potential to appreciate in value once the Federal Reserve cuts rates in the future.

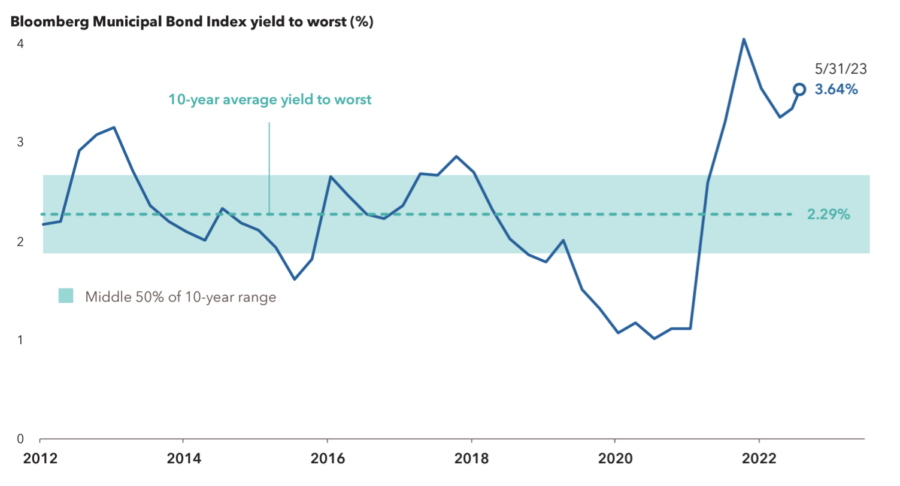
Municipal Bonds: Also Offering Attractive Yields Well Above 10-Year Average
- Federal Reserve’s rate hikes have also pushed municipal bond yields higher to a level that is well above the 10-year average.
- For an investor in the top tax bracket, the current 3.6% rate of the Bloomberg Muni Bond Index (as of 5/31) equates to a roughly 6.1% taxable equivalent yield, which is more than both the Bloomberg U.S. Treasury Index (4%) and the Bloomberg U.S. Aggregate Index (4.6%).
- State and local municipality balance sheets are generally healthy overall, and muni bonds have also historically held up well in periods of economic stress.
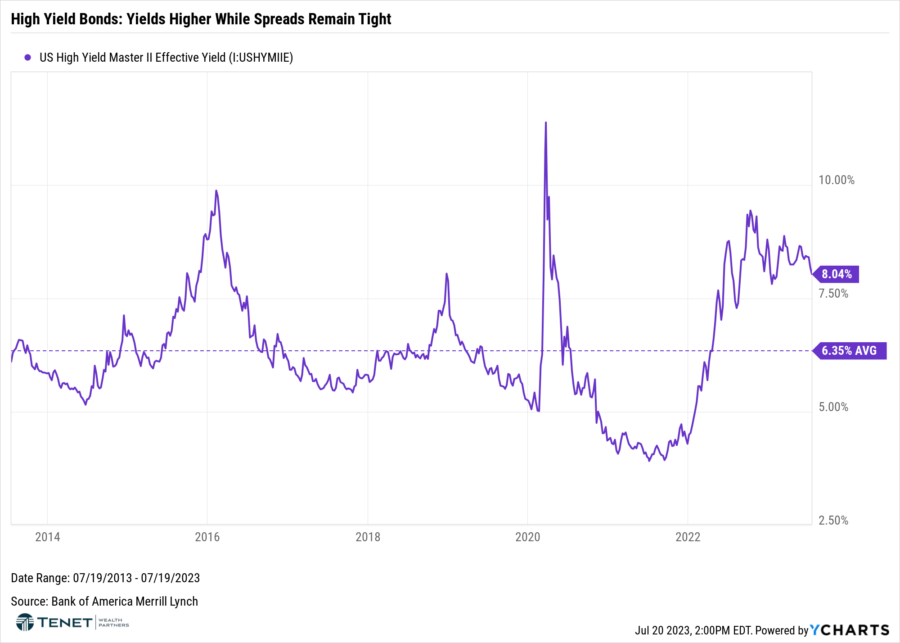
High Yield Bonds: Opportunity for Equity-like Returns With Half the Volatility?
- High Yield Bond rates are currently very attractive with the current yield of 8.15%, which is well above the 10-year average. Yields have been ranging between 8% and 10% right now overall.
- High Yield is also trading at an 87% discount to par, presenting a unique buying opportunity as well.
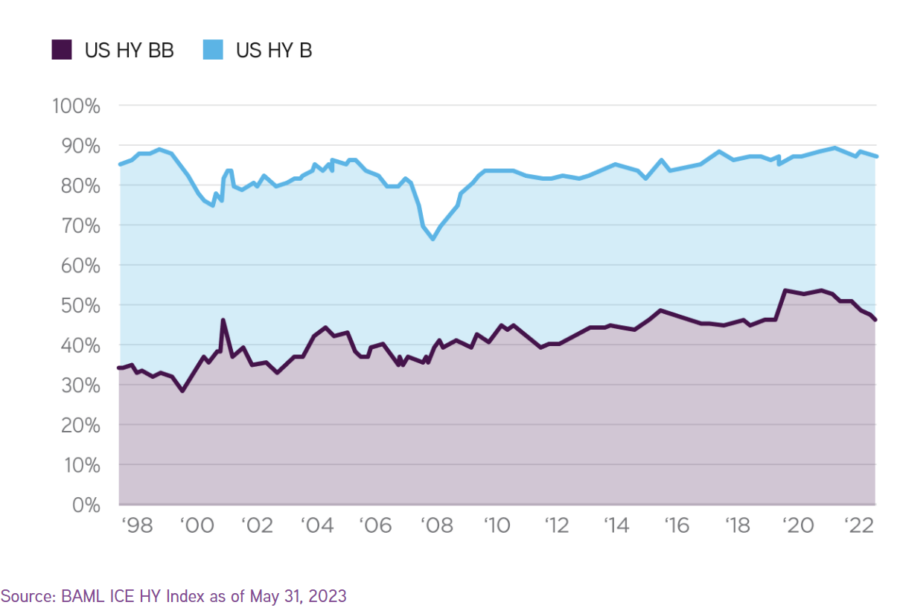
Improved High Yield Bond Quality: Higher Percent of High Yield bonds Rated B
- Most companies have also done a better job of shoring up their balance sheets over the last several years, resulting in a boost to credit ratings and overall quality of these bonds.
- More than half of the high-yield benchmark is composed of BB-rated bonds as of early May 2023, compared to 29% at its lowest point in early 2001. Additionally, over 85% of the market is rated B or better.
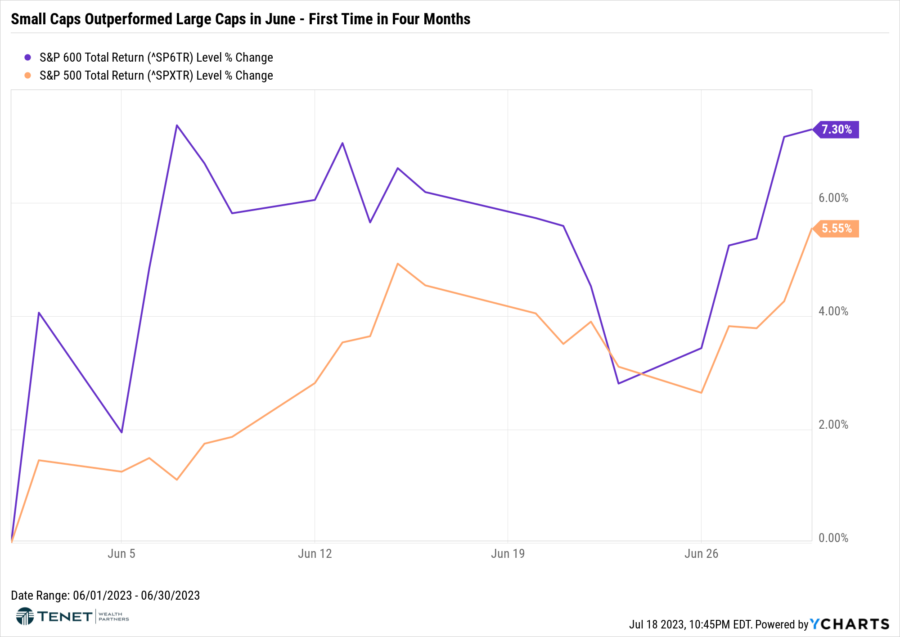
Small vs Large Cap Performance – June 2023
- Small Cap stocks experienced a strong month of June after a sluggish start to the year. Even with the recent increase, Small Cap stocks (as measured by the Russell 2000 index) are still down over 17% from the high we saw in 2021.
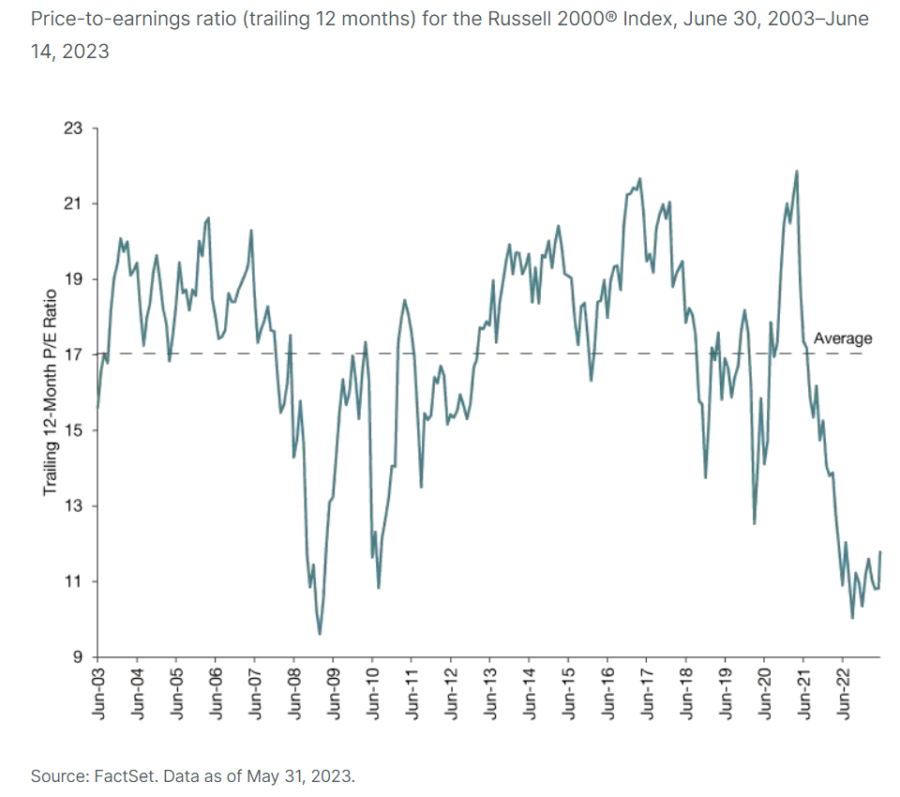
U.S. Small Cap Valuations Attractive vs. Large & Mid Cap
- When considering contracting valuations and downward earnings revisions broadly across the Small Cap space, there may be an attractive entry point for investors. Sentiment is also fairly negative, and there has been a considerable slowdown in the Initial Public Offering (IPO) market. Historically, a reduction in IPO activity has led to strong subsequent returns in Small Cap equity.
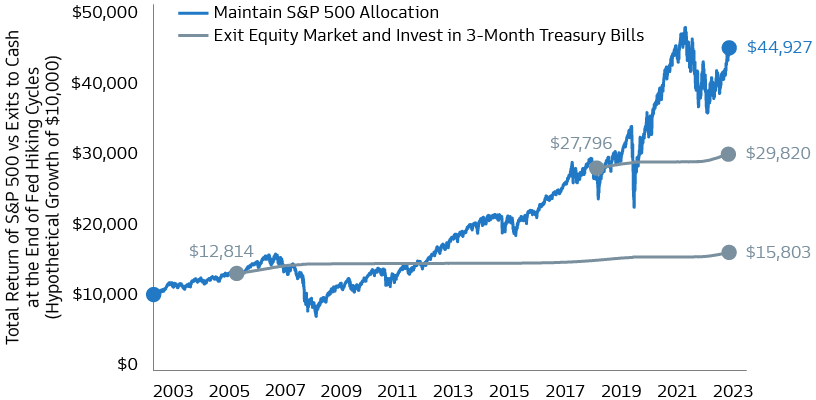
Staying the Course vs. Going to Cash: Remain Focused on the Long Haul!
- Finally, given the recent market surge, we feel it is an opportune time to remind investors the importance of staying the course. While it may be tempting to sell stocks at what appears to be a high (especially with cash yielding attractive rates currently), this practice has historically been less profitable, particularly following the end of a Fed tightening cycle like we are seeing now.
- The below chart illustrates that the variance of returns between exiting to cash versus sticking with your stocks has been significant. Rebalancing back to target allocations in these periods can be beneficial for investors, but the focus should remain on having your portfolio support your long-term aspirations. The difference can be meaningful both to your bottom line as well as your peace of mind!
The information provided in this communication was sourced by Tenet Wealth Partners through public information and public channels and is in no way proprietary to Tenet Wealth Partners, nor is the information provided Tenet Wealth Partner’s position, recommendation or investment advice. This material is provided for informational/educational purposes only. This material is not intended to constitute legal, tax, investment or financial advice. Registered Representatives of Sanctuary Securities Inc. and Investment Advisor Representatives of Sanctuary Advisors, LLC. Securities offered through Sanctuary Securities, Inc., Member FINRA, SIPC. Advisory services offered through Sanctuary Advisors, LLC., an SEC Registered Investment Advisor. Tenet Wealth Partners is a DBA of Sanctuary Securities, Inc. and Sanctuary Advisors, LLC.

