For many families, a home is more than a place to live. It may be their largest asset, their biggest monthly expense, and one of the most significant financial decisions they make.
Housing also plays an important role in the broader economy, accounting for roughly 15% to 18% of U.S. economic activity.¹ Changes in the housing market can ripple through household finances, consumer spending, and the economy more broadly.
Today, one of the biggest factors shaping the housing market is the cost of borrowing. The average 30-year fixed mortgage rate has recently moved back above 7% after falling closer to 6% earlier this year.
For buyers, that can mean a noticeably different monthly payment. For homeowners who already have a lower mortgage rate, it can make the decision to move more complicated. And for families considering a purchase, sale, or refinance, it raises an important question: What does today’s rate environment mean for your financial picture?
Putting Today’s Mortgage Rates in Perspective
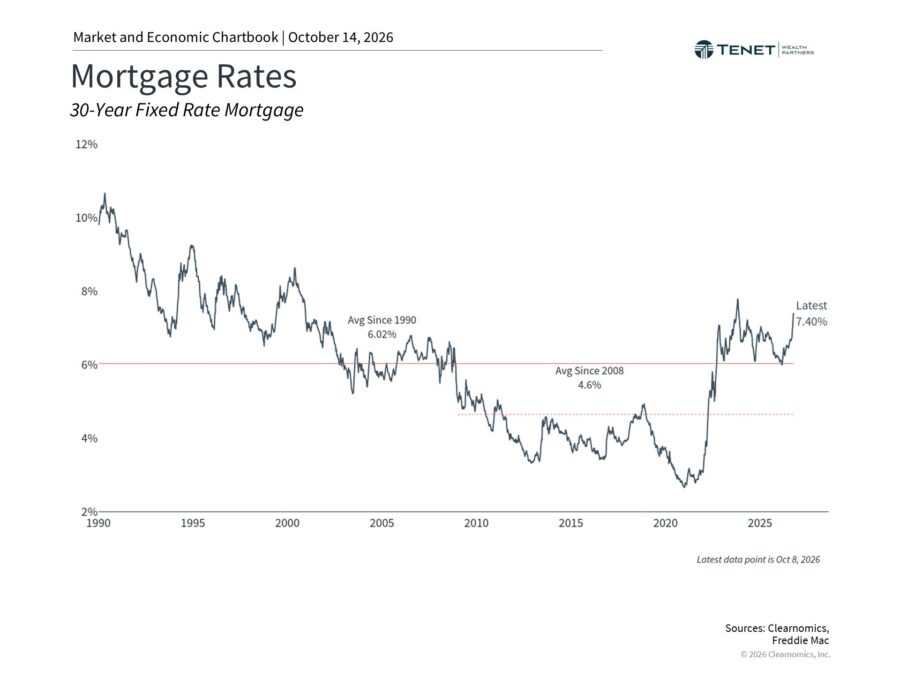
Mortgage rates generally declined alongside long-term Treasury yields from the early 1980s through 2020, when they reached historic lows during the pandemic.
For context, the average 30-year fixed mortgage rate was about 6% from 1990 through the 2008 financial crisis. Since then, the average has been closer to 4.6%.
That helps explain why today’s rates can feel particularly high. During the pandemic, many borrowers secured mortgages at 3% or below. After years of unusually low borrowing costs, a mortgage rate above 7% can meaningfully change the math behind buying a home.
Why Some Homeowners Aren’t Moving
Higher rates aren’t only affecting buyers. They’re also influencing homeowners who might otherwise consider selling.
Someone with a mortgage rate of 3% or 4% may think twice about giving it up to purchase another home at a significantly higher rate. Economists often refer to this as the “lock-in” effect.
When more homeowners decide to stay put, fewer existing homes come to market and overall sales activity can slow.
Recent data reflects that dynamic. According to the National Association of Realtors, existing home sales fell 2.0% from July to August and 1.2% compared with a year earlier.² Inventory has increased to approximately 4.9 months of supply for existing homes and 8.5 months for new homes.³
More inventory may create additional options for buyers, but there is an important nuance. Months of supply is measured relative to the pace of sales, so an increase can also reflect homes taking longer to sell.
For Buyers, Affordability Is About More Than the Purchase Price
When mortgage rates rise, the same purchase price can result in a meaningfully different monthly principal-and-interest payment.
That can affect how much a buyer qualifies for, but qualification is only one part of the decision. The larger question is how a home fits within the rest of the household’s financial life.
A buyer may find themselves weighing location, home size, the amount of a down payment, or whether now is the right time to purchase at all.
The decision can also affect other parts of a financial plan. Committing more cash to a down payment, for example, may change the amount available for other near-term priorities. A home purchase can also affect cash flow, savings goals, and longer-term plans.
The mortgage rate matters, but it is only one piece of the decision.
Home Prices Tell a Different Story
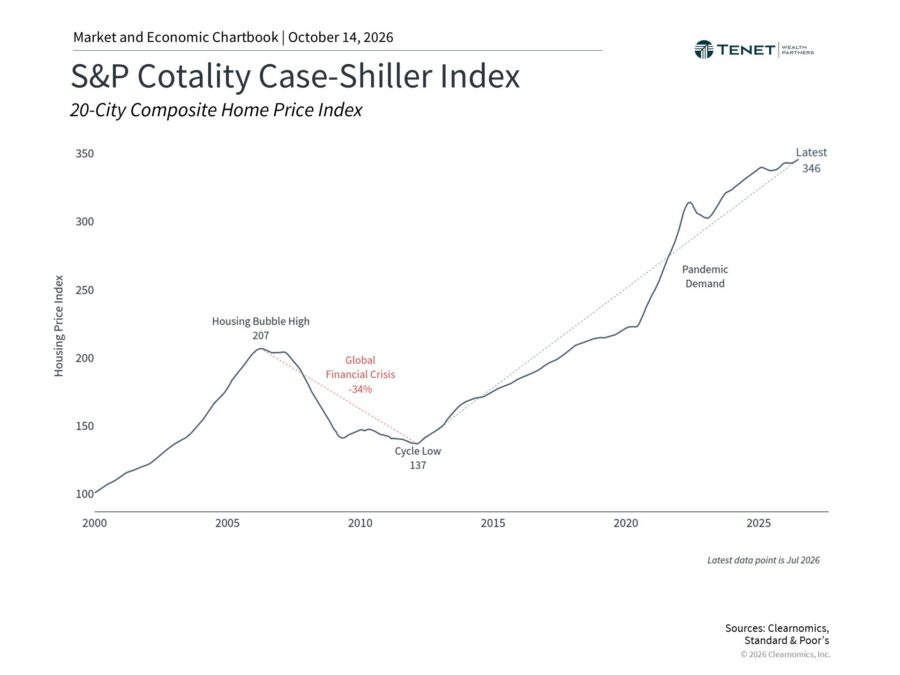
Despite slower sales activity, national home prices remain near record levels according to the S&P Cotality Case-Shiller Index.
At first glance, high prices and slower sales may seem contradictory. But many homeowners who purchased or refinanced when rates were lower have little financial incentive to move. With unemployment remaining relatively low, many are also continuing to make their mortgage payments and stay in their homes.
Higher home values can affect household behavior in another way through what economists call the “wealth effect.” When families see the value of their homes or investment portfolios rise, they may feel more comfortable spending.
That may be one factor supporting consumer spending even as consumer sentiment has remained relatively weak.⁴ At the same time, households continue to feel the effects of higher everyday costs. Shelter costs, which account for more than one-third of the Consumer Price Index, have risen about 3% over the past year, while gasoline prices have increased 27.4%.⁵
These competing forces help illustrate why the economic picture can feel very different from one household to another.
Refinancing Is a Much Harder Decision Today
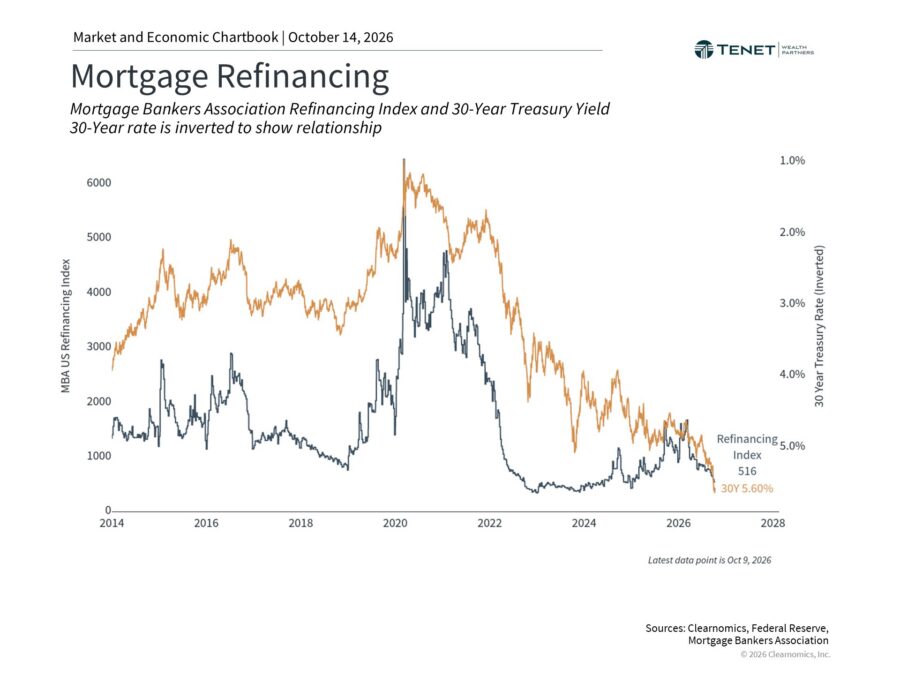
Refinancing activity has also fallen sharply as rates have risen.
From 2020 through 2022, many homeowners were able to refinance at historically low rates, whether to lower their monthly payments or access home equity. Today, refinancing may be considerably less attractive for someone who already has a low-rate mortgage.⁶
That doesn’t mean households are necessarily under the same type of debt pressure seen before the 2008 financial crisis.
Mortgage debt remains the largest component of household borrowing, but total household debt payments, including mortgage and consumer debt, represented approximately 11% of disposable income in the second quarter of this year. That remains below the pre-2008 peak of nearly 16%.⁷
Still, having substantial equity in a home and having ready access to that equity are two different things. With refinancing rates higher than they were in recent years, accessing home equity may come at a greater cost.
Where Could Mortgage Rates Go From Here?
There is no reliable way to know exactly where mortgage rates go next.
Treasury yields across several maturities are currently near 20-year highs.⁸ Inflation also remains above the Federal Reserve’s target, and the Fed’s latest projections suggest policy rates could remain elevated through at least 2027.⁹
Those projections can change. Inflation, employment, energy prices, economic growth, and other developments can all influence the path of interest rates.
Rather than building a financial decision around a prediction of where rates might be six or twelve months from now, it may be more useful to evaluate whether the decision works under today’s circumstances.
Bringing the Housing Decision Back to Your Financial Plan
A home often sits at the intersection of several parts of a financial plan. It affects cash flow, liquidity, taxes, debt, and long-term wealth.
That is why decisions about buying, selling, refinancing, or using home equity are rarely just mortgage decisions.
For someone considering a change, the conversation may include questions such as:
- How much cash do you want tied up in the home?
- What would a higher monthly payment mean for your other priorities?
- How does home equity fit into your overall net worth?
- Would a purchase or renovation change the amount you keep in reserve?
- How does the decision interact with your investment, retirement, and tax planning?
There may not be one answer that works for every household. The goal is to understand the tradeoffs and make the decision in the context of the rest of your financial life.
The Bottom Line
Mortgage rates above 7% have changed the housing equation for both buyers and homeowners. Higher borrowing costs can make purchases more expensive, discourage existing homeowners from moving, and make refinancing less attractive. At the same time, home prices remain near record levels nationally.
For families making a housing decision, the question isn’t necessarily whether rates are “high” or “low,” or whether they will rise or fall next. It’s whether the decision in front of you fits your cash flow, liquidity needs, and longer-term priorities.
If you’re considering a home purchase, sale, refinance, or another significant housing decision, your Tenet Wealth Partners advisor can help you look at how it fits alongside the other pieces of your financial plan.
References
- National Association of Home Builders, Housing’s Contribution to Gross Domestic Product.
- National Association of Realtors, Existing Home Sales, August 2026.
- National Association of Realtors, housing statistics.
- University of Michigan, Surveys of Consumers.
- U.S. Bureau of Labor Statistics, Consumer Price Index.
- Clearnomics research and the Mortgage Bankers Association, as of September 28, 2026.
- Clearnomics research and Federal Reserve Economic Data, as of September 28, 2026.
- U.S. Department of the Treasury, interest rate statistics.
- Federal Reserve, Summary of Economic Projections, September 2026.
Index Description
S&P Cotality Case-Shiller Home Price Indices: The S&P Cotality Case-Shiller 20-City Index measures the value of residential real estate and tracks changes in the selling prices of single-family homes across 20 major U.S. metropolitan areas. Indices are unmanaged, and you cannot invest directly in an index.
See How a Housing Decision Fits Your Full Financial Plan
Buying, selling, refinancing, or tapping home equity can affect your cash flow, liquidity, and long-term goals. A planning conversation can help you weigh the tradeoffs before you make a move.
No pressure. Just a conversation about your financial plan.

Investment advisory services offered through Tenet Wealth Partners, LLC, a registered investment advisor with the U.S. Securities and Exchange Commission. This material is intended for informational purposes only. It should not be construed as legal or tax advice and is not intended to replace the advice of a qualified attorney or tax advisor. This information is not an offer or a solicitation to buy or sell securities. The information contained may have been compiled from third-party sources and is believed to be reliable.
The information provided in this communication was sourced by Tenet Wealth Partners through public information and public channels and is in no way proprietary to Tenet Wealth Partners, nor is the information provided Tenet Wealth Partner’s position, recommendation or investment advice.
This material is provided for informational/educational purposes only. This material is not intended to constitute legal, tax, investment or financial advice. Investments are subject to risk, including but not limited to market and interest rate fluctuations.
Any performance data represents past performance which is no guarantee of future results. Prices/yields/figures mentioned herein are as of the date noted unless indicated otherwise. All figures subject to market fluctuation and change. Additional information available upon request.
About The Author
Kevan Melchiorre, CFP®Co-Founder & Managing Partner
Kevan Melchiorre co-founded Tenet Wealth Partners in 2021 with a focus on delivering a premier client experience, supported by an innovative and fully integrated approach to wealth planning. As a CERTIFIED FINANCIAL PLANNER® practitioner with over 18 years of wealth management experience, Kevan partners with affluent individuals, families, and institutions to help align their capital […]
Learn more about Kevan