Interest rates have become one of the defining themes in today’s financial markets. They influence everything from borrowing costs and mortgage rates to bond prices and stock valuations. As Treasury yields have risen to levels not seen in years, many investors are asking what this means for their portfolios.
One concept that has become increasingly important is the real interest rate, sometimes called the real yield. Unlike a bond’s stated interest rate, a real yield accounts for inflation, providing a clearer picture of purchasing power over time.
Understanding how real interest rates work, and why they have moved higher, can provide helpful context when evaluating today’s investment environment and reviewing a long-term financial plan.
What Are Real Interest Rates?
Every bond pays a stated interest rate, known as its nominal yield. A real yield adjusts that rate for expected inflation, providing a clearer picture of what an investor may actually earn after considering the impact of rising prices. For example, if a bond pays 5% and inflation averages 3%, the real return is approximately 2%.
Real yields have changed significantly over the past decade. Following the Global Financial Crisis and during the pandemic, the Federal Reserve kept interest rates exceptionally low to support the economy. During parts of that period, real yields even turned negative as investors accepted lower purchasing power in exchange for the safety of U.S. Treasury securities, while low interest rates encouraged investment in stocks, real estate, and other higher-return assets.
That changed in 2022 as inflation accelerated and the Federal Reserve raised interest rates. Both nominal Treasury yields and real yields moved sharply higher, creating a very different investment environment.
The chart below illustrates this shift. After remaining near zero, and at times negative, for much of the post-Global Financial Crisis period, real yields have risen significantly since 2022 as Treasury yields increased while long-term inflation expectations remained relatively stable.
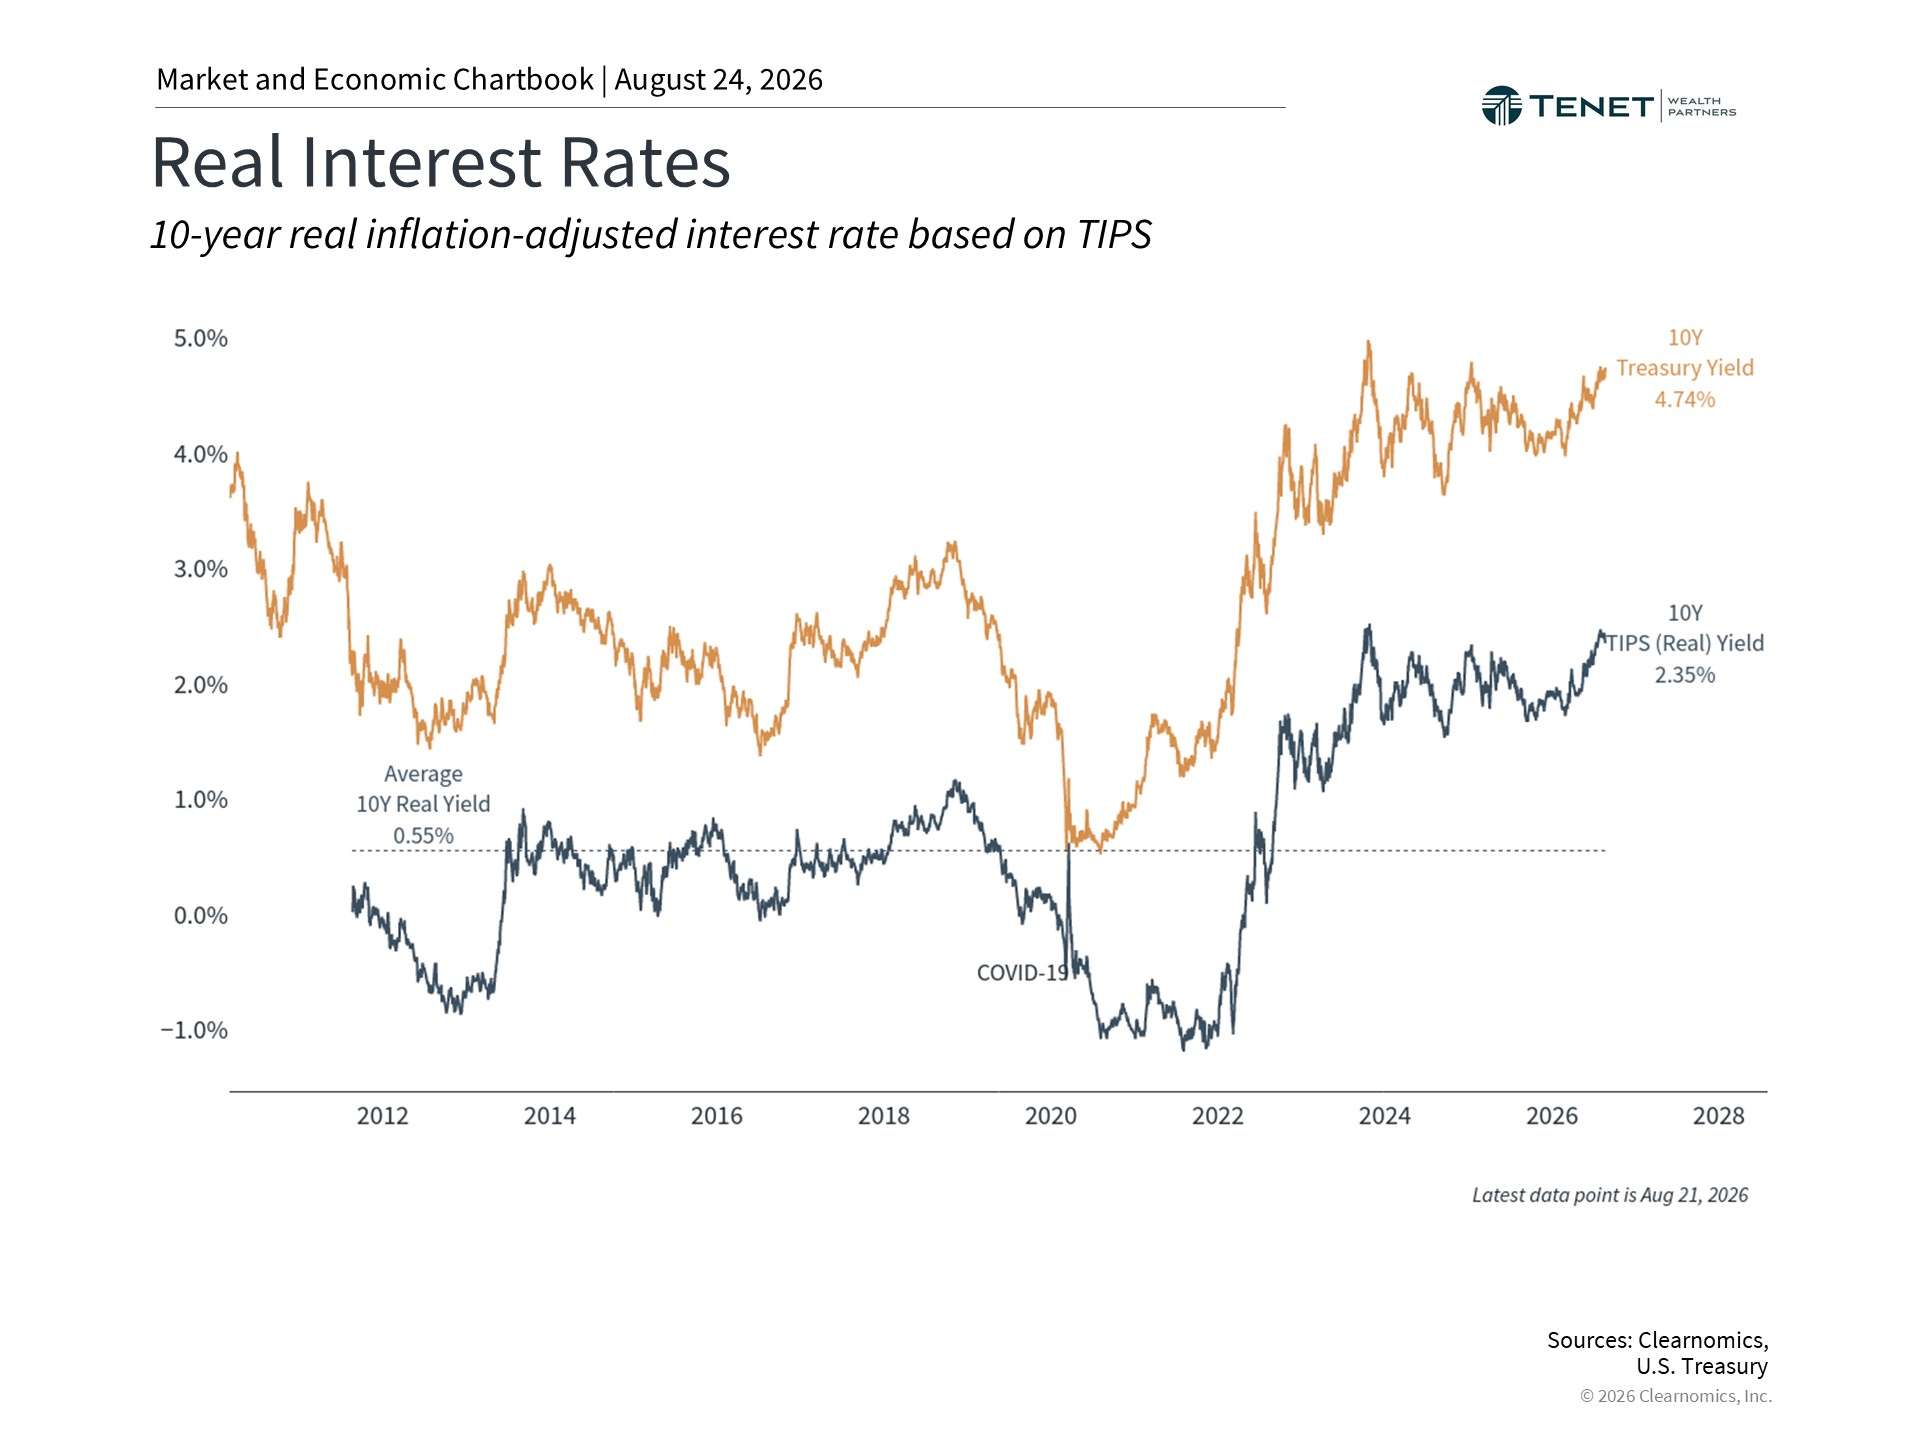
Real interest rates have increased significantly since 2022 as Treasury yields have risen and inflation expectations have evolved.
Today, the 10-year Treasury yield is approximately 4.7%, while the corresponding real yield is around 2.4%, well above levels seen for much of the past decade. Because real yields account for inflation expectations, they provide useful perspective when evaluating fixed-income investments and comparing opportunities across different asset classes.
Why Have Real Interest Rates Increased?
There is no single reason interest rates have remained elevated.
Inflation continues to influence markets, even as it has moderated from recent highs. At the same time, expectations for Federal Reserve policy have helped keep Treasury yields elevated as investors anticipate the Fed may maintain higher interest rates if inflation remains persistent.
Separately, rising government debt and budget deficits have also contributed to higher long-term Treasury yields by increasing the compensation investors expect for holding longer-term government bonds.
Together, these factors have created an interest rate environment that looks very different from the one investors experienced for much of the previous decade.
What Do Higher Interest Rates Mean for Stocks?
Higher interest rates do not only affect bonds. They also influence how investors evaluate stocks.
One way investors compare the two is through the stock market’s earnings yield, which measures expected corporate earnings relative to stock prices. Comparing the earnings yield with Treasury yields helps investors assess the additional return they may receive for taking on the additional risk associated with stocks, a concept often referred to as the equity risk premium.
The chart below compares the S&P 500’s earnings yield with the 10-year Treasury yield. As Treasury yields have increased, the gap between stock earnings yields and Treasury yields has narrowed compared with much of the past two decades, changing how investors evaluate the relative appeal of stocks and bonds.
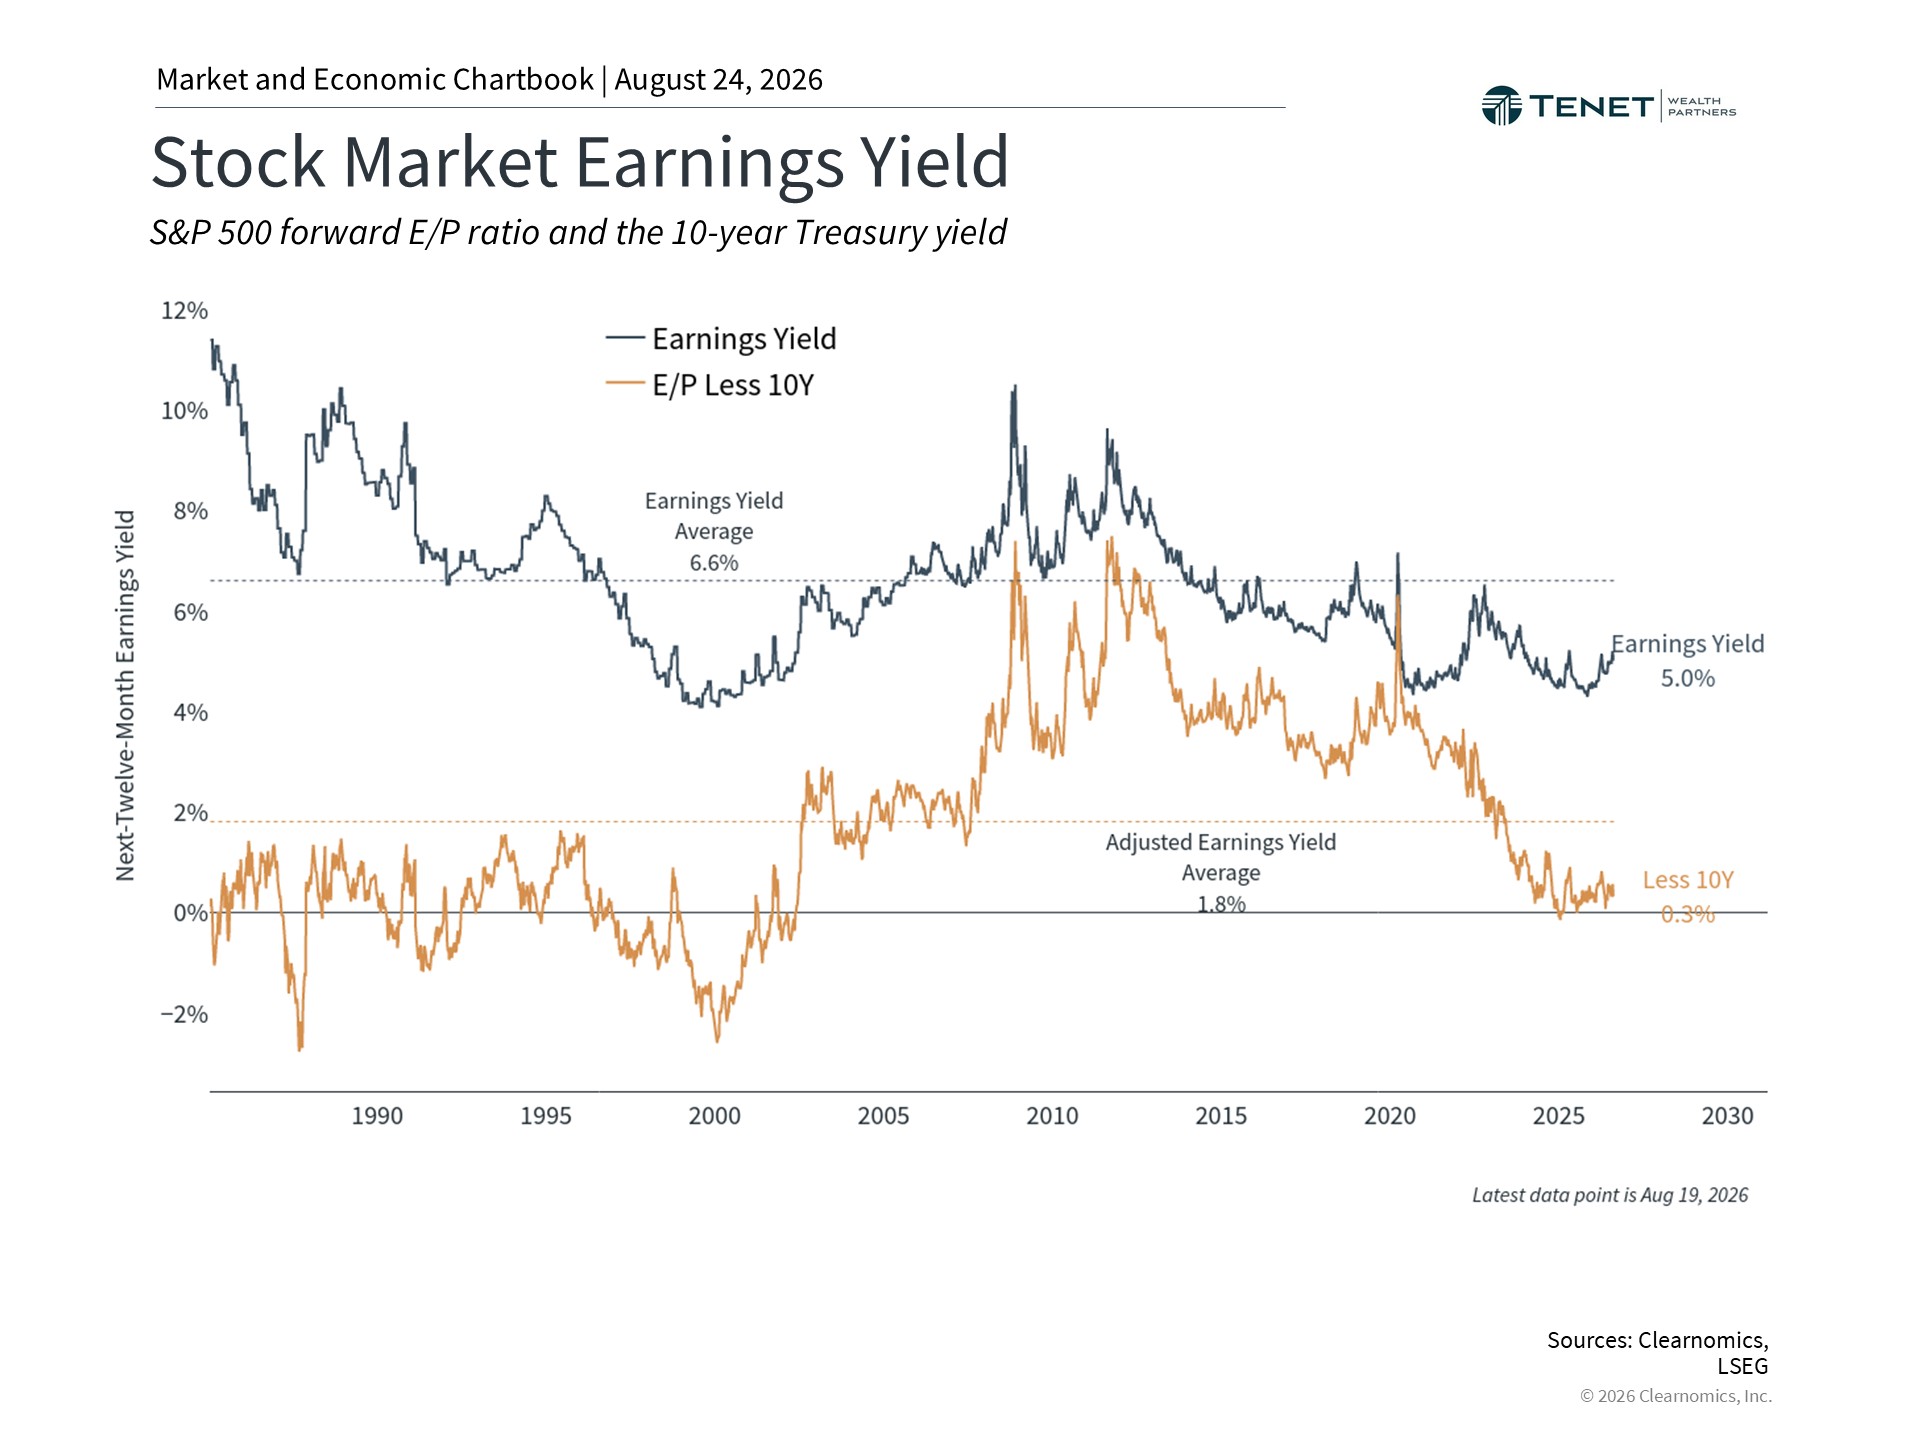
As Treasury yields have increased, the difference between stock earnings yields and Treasury yields has narrowed compared with much of the past two decades.
When Treasury yields remained near zero, or even negative, for much of the period following the Global Financial Crisis, bonds offered relatively little income. As a result, many investors accepted lower earnings yields from stocks because there were few alternatives for generating income while pursuing long-term growth. This environment became widely known as TINA, short for There Is No Alternative.
Today, the S&P 500’s earnings yield is approximately 4.9%, while the 10-year real Treasury yield is around 2.4%. With government bonds once again offering meaningful inflation-adjusted income, evaluating the balance between stocks and bonds has become increasingly important. A diversified portfolio should continue to reflect your financial goals, investment timeline, and tolerance for risk.
How Does the Federal Reserve Affect Interest Rates?
Another factor shaping today’s interest rate environment is the Federal Reserve’s balance sheet. During the Global Financial Crisis and the pandemic, the Fed purchased Treasury securities and mortgage-backed securities to support financial markets and the broader economy, significantly increasing the size of its balance sheet.
The chart below shows how the Federal Reserve’s balance sheet expanded during periods of economic stress and has gradually declined in recent years as securities have matured. Although it has decreased from its pandemic peak, the balance sheet remains substantially larger than it was before the Global Financial Crisis.
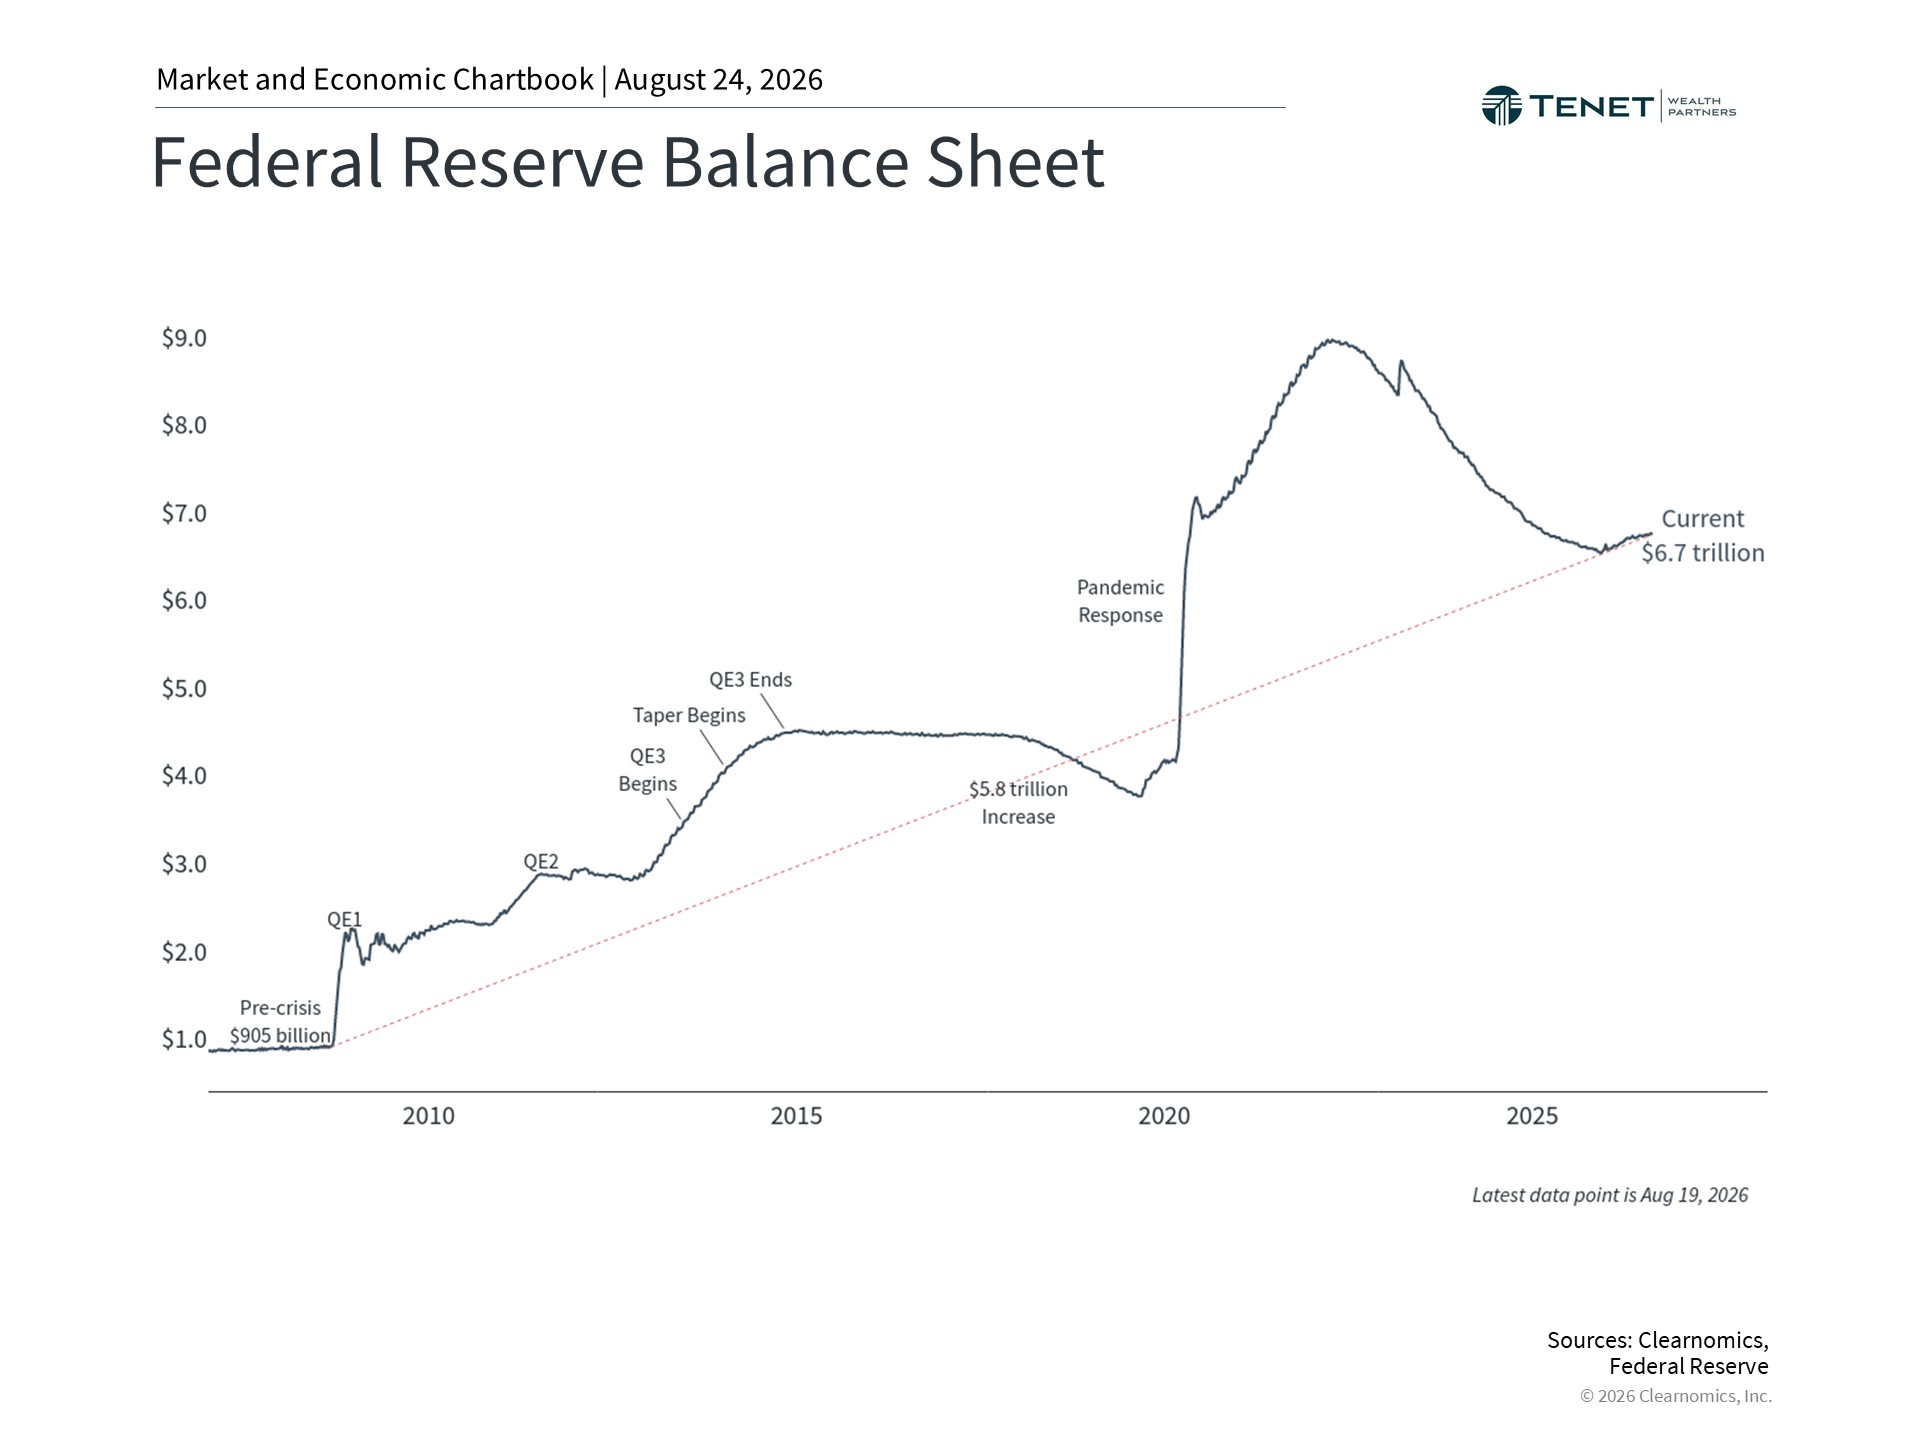
Although the Federal Reserve’s balance sheet has declined from its pandemic peak, it remains substantially larger than it was before the Global Financial Crisis.
As the Federal Reserve continues reducing its holdings, more Treasury securities are absorbed by private investors rather than the central bank. Alongside decisions about short-term interest rates, this may continue to influence long-term Treasury yields and borrowing costs. While monetary policy will continue to evolve, the Fed’s balance sheet remains one of several factors shaping today’s interest rate environment.
What Do Higher Real Interest Rates Mean for Investors?
It is natural to wonder whether higher interest rates should change the way you invest. Rather than trying to predict where interest rates will move next, it may be more helpful to consider how today’s environment fits within your broader financial plan.
Higher yields have created new opportunities for fixed-income investors, while stocks continue to play an important role in long-term growth. As market conditions evolve, reviewing your portfolio periodically can help determine whether your investment mix continues to align with your goals, time horizon, and tolerance for risk.
More importantly, today’s environment is a reminder that markets are constantly changing. A well-diversified portfolio is designed to adapt through different market cycles, allowing investors to stay focused on long-term objectives rather than short-term shifts in interest rates.
The Bottom Line on Higher Real Interest Rates
Real interest rates have risen to their highest levels in years, changing how many investors evaluate both stocks and bonds. While inflation, Federal Reserve policy, and government borrowing have all contributed to today’s environment, the more important question is not where interest rates go next, but how they fit within your long-term financial plan.
Understanding how interest rates influence different asset classes can provide valuable perspective when making investment decisions. Rather than reacting to changing market conditions, periodically reviewing your portfolio can help determine whether it continues to align with your goals, time horizon, and tolerance for risk.
References
- U.S. Department of the Treasury, Interest Rate Statistics:
https://home.treasury.gov/policy-issues/financing-the-government/interest-rate-statistics - U.S. Congress Joint Economic Committee, Debt Dashboard:
https://www.jec.senate.gov/public/index.cfm/republicans/debt-dashboard - Clearnomics research and LSEG data as of July 27, 2026.
- Board of Governors of the Federal Reserve System, Recent Balance Sheet Trends:
https://www.federalreserve.gov/monetarypolicy/bst_recenttrends.htm
Index Description
S&P 500 Index: The Standard & Poor’s 500 Index is a capitalization-weighted index of 500 stocks designed to measure the performance of the broad U.S. equity market. Indexes are unmanaged, do not incur management fees, costs, or expenses, and cannot be invested in directly.
Build Trust Into Your Financial Planning
A fiduciary planning relationship can help bring greater clarity, structure, and confidence to the decisions that shape your long-term future.
No pressure. Just a conversation about your financial plan.

Investment advisory services are offered through Tenet Wealth Partners, LLC, a registered investment advisor with the U.S. Securities and Exchange Commission. This material is intended for informational purposes only. It should not be construed as legal, tax, investment, or financial advice and is not intended to replace the advice of a qualified attorney, tax advisor, or financial professional. The information contained herein may have been compiled from third-party sources and is believed to be reliable; however, no representation is made as to its accuracy or completeness. This information is not an offer or solicitation to buy or sell securities and should not be construed as individualized investment advice. Investing involves risk, including possible loss of principal. Past performance is not indicative of future results.
About The Author
Kevan Melchiorre, CFP®Co-Founder & Managing Partner
Kevan Melchiorre co-founded Tenet Wealth Partners in 2021 with a focus on delivering a premier client experience, supported by an innovative and fully integrated approach to wealth planning. As a CERTIFIED FINANCIAL PLANNER® practitioner with over 18 years of wealth management experience, Kevan partners with affluent individuals, families, and institutions to help align their capital […]
Learn more about Kevan