

A rising market can bring reassurance, and a new set of questions. As the bull market enters its fifth year, this is a good time to look at what has changed, what has not, and how both fit into your financial plan.
At a Glance
- Since its October 2022 low, the S&P 500 has more than doubled, even through inflation concerns, geopolitical conflict, and sharp pullbacks. Past performance does not guarantee future results.
- A bull market’s age does not tell us how long it will last, and long upswings have included uncomfortable declines.
- Record highs are a normal part of bull markets, but a new high says little about what comes next.
- Valuation measures are mixed, which is one reason to review how your whole portfolio is balanced.
After several years of gains, you may wonder whether stocks have become too expensive, whether a pullback is approaching, or whether your portfolio still reflects the amount of risk you intended to take. If you have been holding cash, you may also wonder whether you have missed your opportunity to invest.
These questions are understandable. The anniversary is a good opportunity to review what has changed and how those changes fit within your financial plan. Historical perspective can help inform that conversation, but it cannot tell us what markets will do next.
The Recovery Looked Far Less Certain Four Years Ago
In October 2022, the investment environment felt very different. Inflation was rising rapidly, the Federal Reserve was increasing interest rates, and concerns about a recession were widespread. Confidence among consumers, businesses, and investors was weak.
The S&P 500 reached its bear-market low on October 12, 2022. From that point through October 9, 2026, the index gained approximately 119% on a price-return basis, which reflects share-price changes only, and 131% with dividends reinvested, according to Clearnomics research using Standard & Poor’s data.2 These figures describe the performance of an index, which cannot be invested in directly, not the return of an individual portfolio. Measuring from a market low also produces a larger gain than many other starting points would. Past performance does not guarantee future results.
Today, major stock indices are near all-time highs. The economy has remained resilient, corporate earnings have increased, and unemployment has stayed low. Inflation remains a concern, with energy prices contributing to uncertainty this year,1 but conditions are very different from those investors faced in 2022.
That contrast is a reminder of how hard it is to judge conditions in real time. When markets are difficult, the outlook can feel especially uncertain. That does not mean investors should ignore risk. It reinforces the value of a plan that can guide decisions when confidence is low as well as when markets are strong.
A Market Anniversary Is Not an Expiration Date
As a bull market gets older, it is natural to ask how much longer it might continue.
Historical data show that bull markets have generally lasted longer than bear markets, with some continuing for a decade or more, as the chart below illustrates. But the age of the current cycle does not tell us how long it will last. Each period has its own economic conditions, risks, and sources of growth.
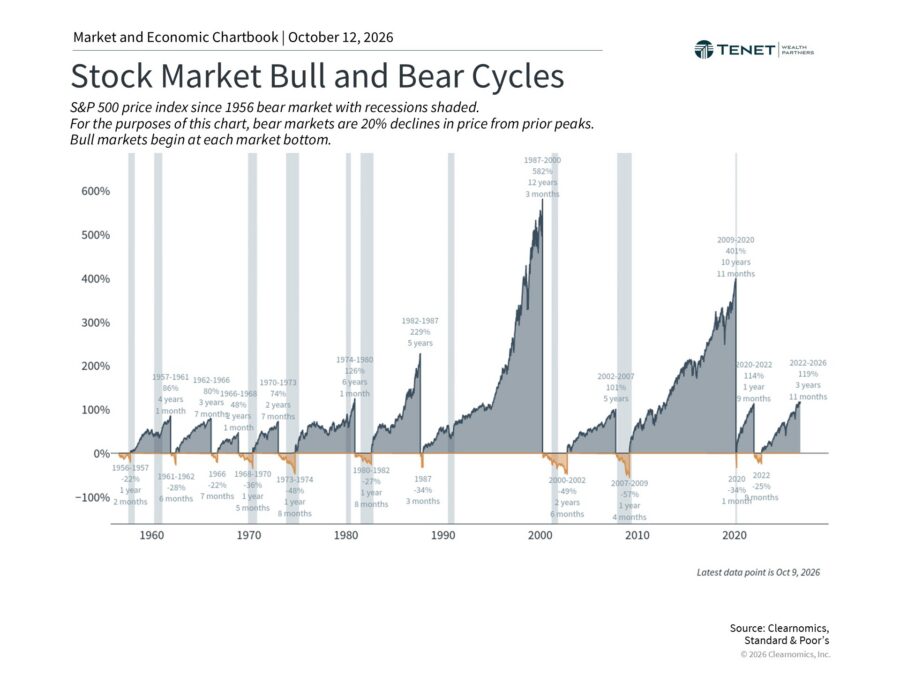
Long expansions have also included uncomfortable interruptions. The bull markets of the 1990s and 2010s encountered growth concerns, geopolitical events, oil-price shocks, and elevated valuations. The current cycle has faced its own challenges, including tariff-related volatility in 2025 and pullbacks associated with the Iran conflict earlier this year.
For investors, the planning implication is that a longer-term upward trend can still include meaningful declines. A portfolio should reflect your ability to tolerate those declines, your need for access to money, and the time available to pursue your goals. The market’s recent strength does not change those underlying considerations.
Record Highs Can Create Pressure to Act
Through October 9, the S&P 500 had reached more than two dozen new all-time highs in 2026.3 Record levels can produce competing reactions. Some investors become concerned that a decline must be near. Others feel pressure to invest more aggressively because they do not want to miss further gains.
Historical context helps explain why a record high, by itself, provides limited guidance. As markets advance during a bull cycle, new highs are a natural part of that progress, and the chart below shows that records have occurred repeatedly across different market cycles.
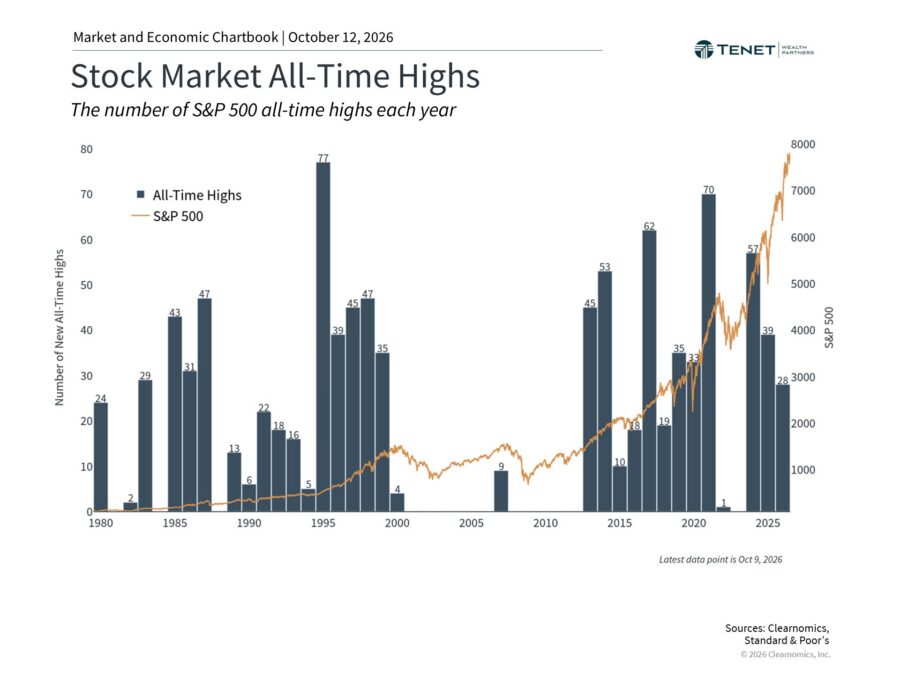
A new high does not mean the next move will be higher. It also does not mean a pullback is imminent.
For someone approaching retirement, the more useful question may be whether the portfolio still supports upcoming spending needs. For someone investing toward a goal decades away, the conversation may center on maintaining an appropriate allocation and avoiding decisions driven by short-term excitement or concern. Your circumstances provide the context that a market milestone cannot.
Higher Prices and Higher Valuations Are Different
Although record highs attract attention, valuations offer another way to assess the market. A valuation measure compares an investment’s price with something about the business behind it, such as earnings, assets, or dividends. It helps investors consider what they are paying for, not simply whether the share price has increased.
The price-to-earnings ratio, for example, compares stock prices with corporate earnings. If earnings grow faster than prices, that ratio can decline even while the market rises. Strong earnings growth has helped bring the S&P 500’s price-to-earnings ratio below its peak from a year earlier. As of October 9, consensus estimates pointed to earnings growth of more than 30% for 2026.4 That figure is an expectation, not a completed full-year result.
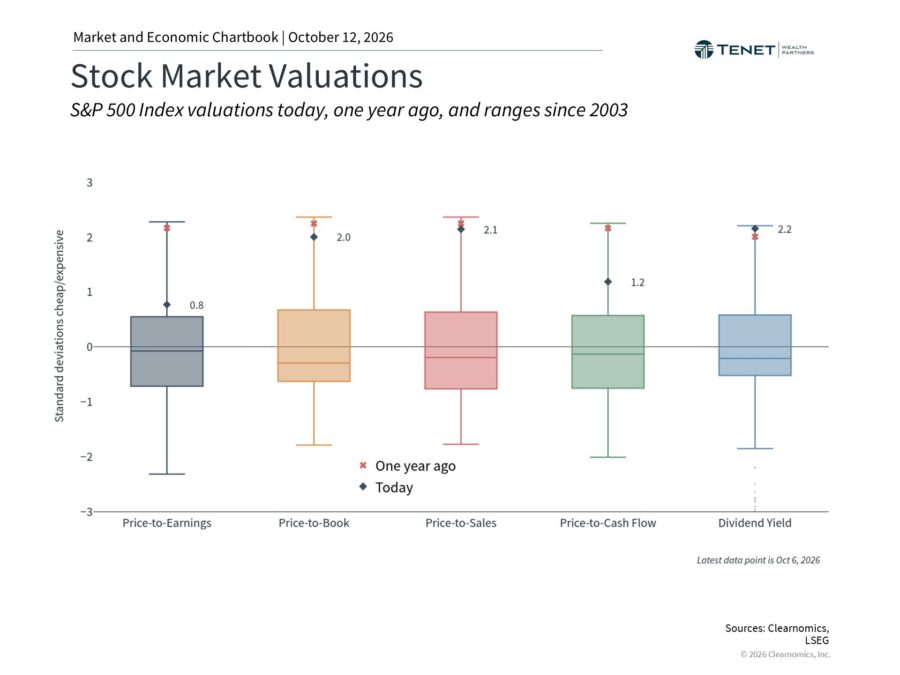
The picture is more mixed when other measures are considered. Price-to-book ratios, which compare prices with companies’ accounting net assets, remain elevated relative to historical averages. Dividend yields are also low compared with current interest rates and bond yields. Valuations differ across the market, too: technology-related sectors may look expensive without every sector or asset class sharing the same characteristics.
The practical takeaway is that market strength and investment value deserve separate consideration. Rising earnings can support higher prices, while elevated valuations can leave less room for disappointing results.
Use Valuations to Inform Planning, Not Predict the Next Move
Valuations can help frame long-term portfolio decisions, but they are unreliable guides to short-term market direction. Expensive markets can remain expensive for extended periods, particularly when earnings continue to grow. That makes it useful to consider the portfolio as a whole.
Bond yields are near multi-decade highs,5 which gives bonds a different valuation backdrop from stocks. That is a reason to consider the roles that growth, income, and risk management play across asset classes. It does not mean bonds are free of risk or that any one allocation is appropriate for every investor. Diversification is intended to help manage exposure to different risks. It cannot prevent every loss or guarantee a particular outcome.
A portfolio review can focus on questions such as:
- Has market growth changed the balance of my portfolio?
- Does my current allocation still reflect my risk tolerance?
- Are upcoming withdrawals or other spending needs accounted for?
- Have my retirement timeline, family circumstances, or financial goals changed?
- Would a portfolio adjustment create tax considerations that need review?
These questions connect investment decisions with the purpose of the money, rather than relying on a prediction about the next market move.
Keep Progress Connected to Your Financial Goals
The recovery since October 2022 has been substantial. It also unfolded through periods when the outlook was uncertain and remaining invested could feel uncomfortable. Your financial goals, cash-flow needs, and time horizon remain central to any review of your portfolio.
If recent market gains have raised questions about your investments, we can talk through how your portfolio fits your financial plan and whether your circumstances call for a closer look.
Schedule Your Consultation. No pressure. Just a conversation about your financial plan.
References
- U.S. Bureau of Labor Statistics, Consumer Price Index news release: bls.gov/news.release/cpi.nr0.htm
- Clearnomics research using Standard & Poor’s data, October 12, 2022 to October 9, 2026
- Clearnomics research and S&P 500 data, as of October 9, 2026
- Clearnomics research and LSEG data, as of October 9, 2026
- U.S. Department of the Treasury, Interest Rate Statistics: home.treasury.gov/policy-issues/financing-the-government/interest-rate-statistics
Index Description
S&P 500: The Standard & Poor’s 500 Index is a capitalization-weighted index of 500 stocks designed to measure performance of the broad domestic economy through changes in the aggregate market value of 500 stocks representing all major industries. The modern design of the S&P 500 stock index was first launched in 1957. Performance prior to 1957 incorporates the performance of the predecessor index, the S&P 90. Indexes are unmanaged and cannot be invested in directly.
Keep Your Portfolio Aligned as Markets Reach New Highs
Record highs and an aging bull market can raise new questions about risk and timing. A portfolio review can help you see whether your allocation, risk tolerance, and upcoming spending needs still fit your long-term financial plan.
No pressure. Just a conversation about your financial plan.

Investment advisory services offered through Tenet Wealth Partners, LLC, a registered investment advisor with the U.S. Securities and Exchange Commission. This material is intended for informational purposes only. It should not be construed as legal or tax advice and is not intended to replace the advice of a qualified attorney or tax advisor. This information is not an offer or a solicitation to buy or sell securities. The information contained may have been compiled from third-party sources and is believed to be reliable.
The information provided in this communication was sourced by Tenet Wealth Partners through public information and public channels and is in no way proprietary to Tenet Wealth Partners, nor is the information provided Tenet Wealth Partner’s position, recommendation or investment advice.
This material is provided for informational/educational purposes only. This material is not intended to constitute legal, tax, investment or financial advice. Investments are subject to risk, including but not limited to market and interest rate fluctuations.
Any performance data represents past performance which is no guarantee of future results. Prices/yields/figures mentioned herein are as of the date noted unless indicated otherwise. All figures subject to market fluctuation and change. Additional information available upon request.
About The Author
Kyle Wetters, CFP®Co-Founder & Managing Partner
Kyle Wetters co-founded Tenet Wealth Partners in 2021, intent on putting his client’s interests above all else. As a CERTIFIED FINANCIAL PLANNER® practitioner, with over 20 years of experience in the financial industry, he specializes in retirement planning for his clients. Kyle listens to his customers’ goals and values to develop long-term strategic plans to […]
Learn more about Kyle