
The third quarter gave investors plenty to digest.
Interest rates climbed to levels not seen in roughly two decades, putting pressure on bonds. At the same time, strong corporate earnings helped major U.S. stock indexes reach new highs. Oil prices moved higher, the Federal Reserve raised rates for the first time in three years, and questions around artificial intelligence and the upcoming midterm election continued to make headlines.
It may sound like a collection of competing signals, and in many ways, it is. Markets rarely move according to one story at a time.
As we head into the final months of 2026, the more useful question isn’t necessarily what happens next. It’s how these developments fit into your broader financial plan and investment strategy.
A Look Back at the Third Quarter¹
The S&P 500 returned 2.3% during the third quarter, while the Nasdaq Composite gained 2.6%. The Dow Jones Industrial Average declined 2.3%. Year-to-date, the three indexes have returned 12.7%, 16.1%, and 7.2%, respectively.
International markets were mixed. Developed market stocks, as measured by the MSCI EAFE Index, gained 0.9%, while emerging market stocks declined 0.4% during the quarter.
Bonds had a more difficult stretch. The Bloomberg U.S. Aggregate Bond Index fell 3.5% during the quarter, bringing its year-to-date decline to 2.9%. Meanwhile, the 10-year Treasury yield climbed to 5.29%, its highest level in roughly two decades.
Commodities moved sharply higher, with the Bloomberg Commodity Index gaining 15.1%. Brent crude ended the quarter at $103 per barrel, while WTI finished at $90.
Inflation also remained in focus. Headline CPI rose 3.4% year-over-year in August, while core CPI increased 2.4%. The Federal Reserve raised its key policy rate in September to a range of 3.75% to 4.00%.
Together, these numbers paint a mixed picture, but they also show why looking beyond any single headline can be helpful.
Higher Rates Are Changing the Conversation Around Bonds and Borrowing
One of the biggest stories of the quarter was the continued rise in interest rates.
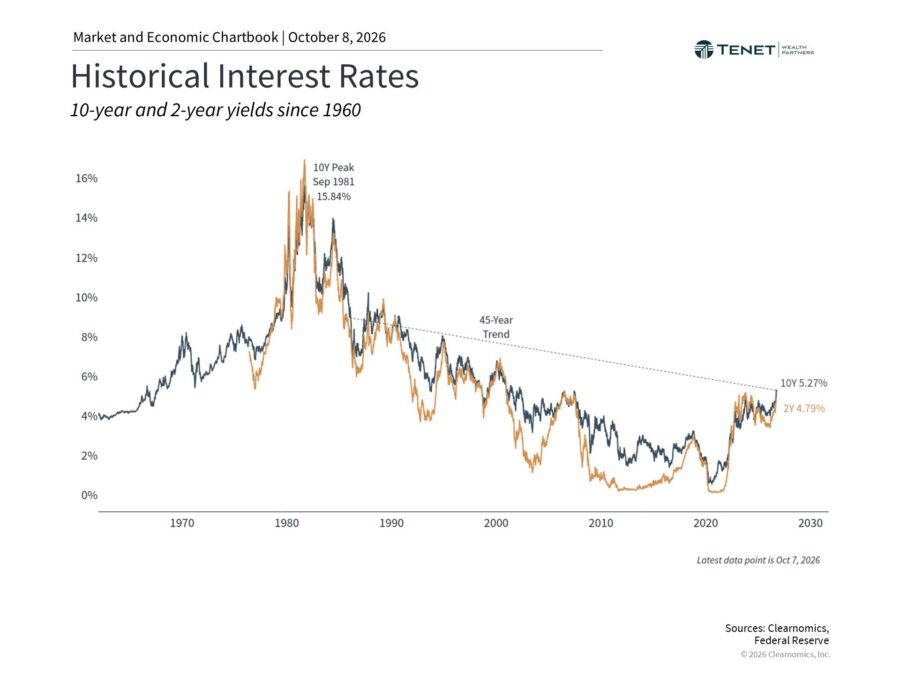
The 10-year Treasury yield ended September at 5.29%. Because bond prices generally move in the opposite direction of yields, rising rates have created a challenging environment for existing bonds, particularly longer-dated bonds.
But there is another side to the story. Higher yields also mean bonds can provide more income than they did during much of the low-rate environment that followed the 2008 financial crisis.
That doesn’t remove the risks associated with bonds or changing interest rates. It does, however, change the conversation around the role fixed income can play within a diversified portfolio.
A longer-term view helps put today’s environment in perspective. Interest rates generally declined from their early-1980s peak through 2020, with shorter-term swings along the way.² Rather than assuming that environment will return, investors can consider bonds based on the role they play in their portfolios today.
Higher rates are also affecting decisions outside of investment portfolios. According to Freddie Mac, the average 30-year fixed-rate mortgage is back above 7% after moving closer to 6% earlier this year.³
For anyone considering a home purchase, refinance, or other significant borrowing decision, today’s financing costs are another piece of the financial-planning conversation.
Market Gains Have Extended Beyond One Corner of the Market
Despite periods of uncertainty, the S&P 500, Nasdaq, and Dow all reached new highs during the third quarter. Corporate earnings and continued investment in AI infrastructure have been important contributors.⁴
The story has also been broader than U.S. large-cap stocks.
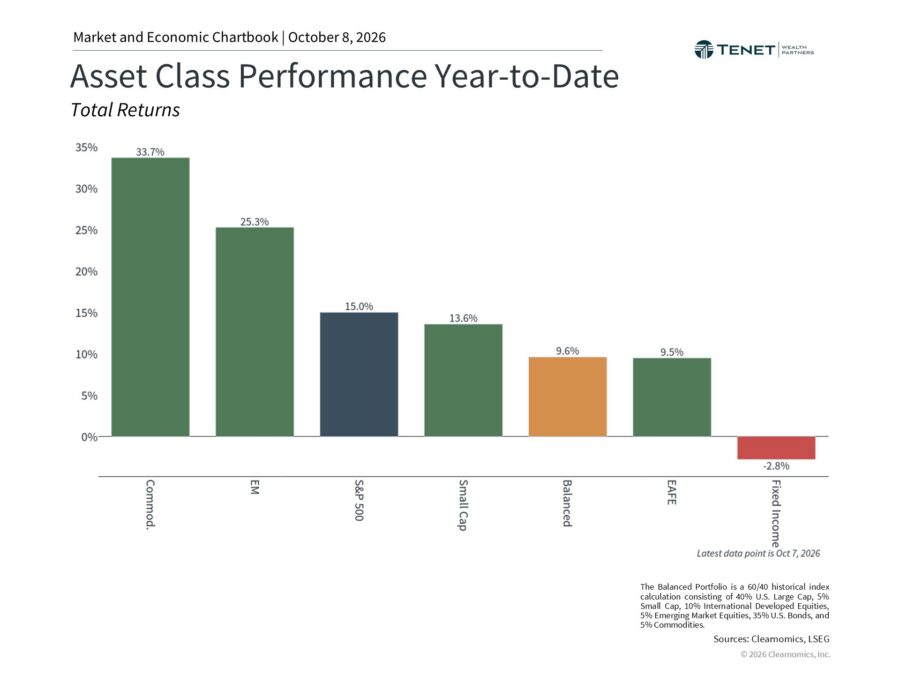
Commodities, emerging markets, small caps, and developed international stocks have all posted positive year-to-date returns. AI-related investment has supported companies throughout the supply chain, including semiconductor businesses in Asia.⁵
Commodities benefited from a different set of factors. Oil prices moved from roughly $70 per barrel in early July to more than $100 in September amid continued conflict in the Middle East. Copper also reached a new high as supply constraints coincided with demand related to infrastructure and data-center development.
Bonds have been the notable exception as rising rates weighed on fixed-income returns.
The broader takeaway isn’t that every part of a portfolio will perform well at the same time. In fact, they often won’t. Different investments can respond differently to changes in interest rates, economic growth, inflation, and other market conditions. That is one reason diversification remains an important part of portfolio construction.
Diversification does not guarantee a profit or protect against loss.
The Fed Is Raising Rates Again. What Changed?
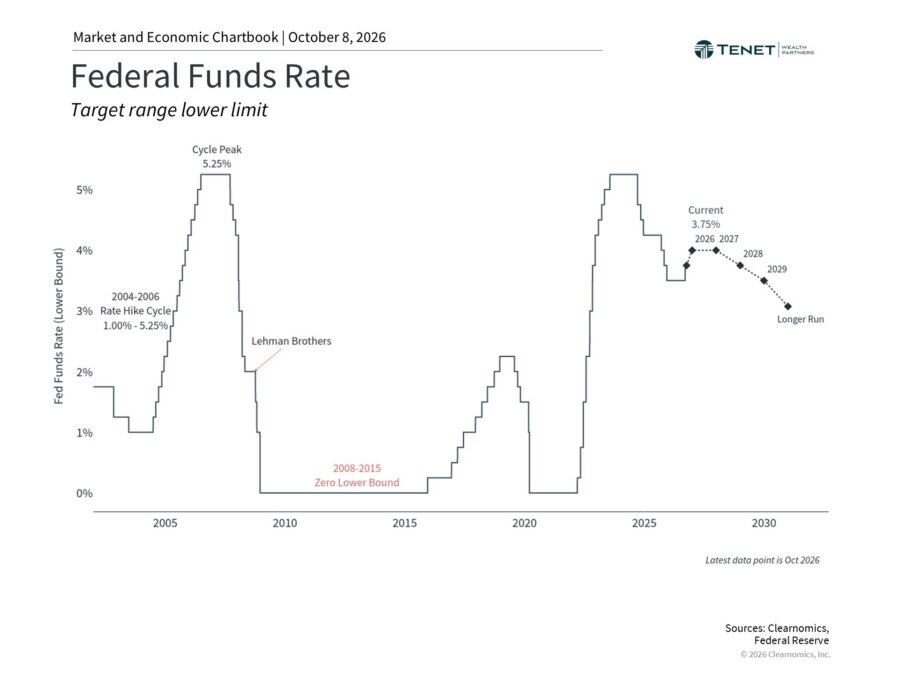
At its September meeting, the Federal Reserve raised its policy rate by one-quarter of a percentage point to a range of 3.75% to 4.00%. It was the Fed’s first rate increase in three years, following a period of rate cuts from September 2024 through December 2025.
This time, higher energy prices are an important part of the equation.
Economists often call this “cost-push inflation,” but the idea is relatively straightforward: supply disruptions can push prices higher. The Fed cannot solve geopolitical conflicts by changing interest rates, but it can respond if higher energy costs begin affecting inflation more broadly.
Current projections suggest Fed officials could raise rates once more this year before pausing through 2027, with rates potentially declining gradually after that. Those projections are not a promise or a schedule. They can change as inflation, employment, energy prices, and other economic conditions evolve.
For investors, that distinction matters. Trying to predict each Fed decision can be difficult. Understanding how different rate environments affect your portfolio and financial plan can be far more useful.
Keeping Election Headlines in Perspective
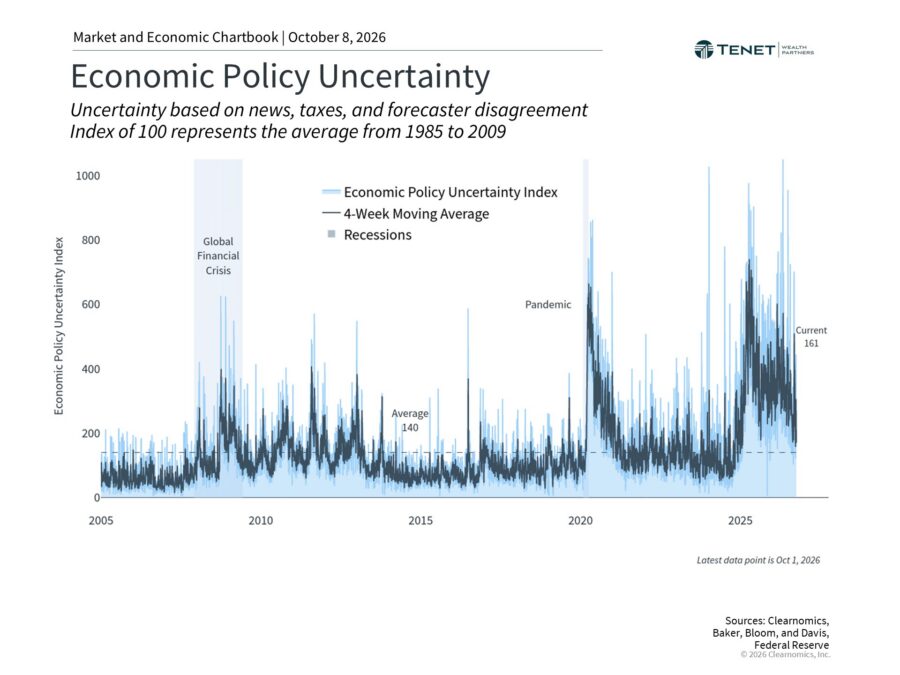
With the midterm election approaching, politics will likely occupy even more of the news cycle.
Elections matter. They can influence taxes, government spending, entitlement programs, and other policies that affect households and businesses. But political importance doesn’t necessarily translate neatly into an investment decision.
Since 1933, the S&P 500 has averaged an annual total return of 8.6% during midterm election years.⁶ Markets have also produced positive results, on average, under different configurations of Congress. Historical averages, of course, tell us what happened in the past. They cannot tell us how markets will respond to this election.
Fiscal policy is another issue investors are watching. Federal debt recently exceeded $40 trillion, while the annual budget deficit is projected to surpass $2 trillion for the government’s 2026 fiscal year.⁷ ⁸ Over time, higher debt levels could affect government borrowing costs and interest expenses.
These are meaningful issues, but they are also difficult for any individual investor to control.
Rather than positioning a portfolio around a particular election outcome, it can be more useful to keep investment decisions grounded in your goals, time horizon, and comfort with risk.
AI Is Still a Major Market Story, but the Longer-Term Questions Remain
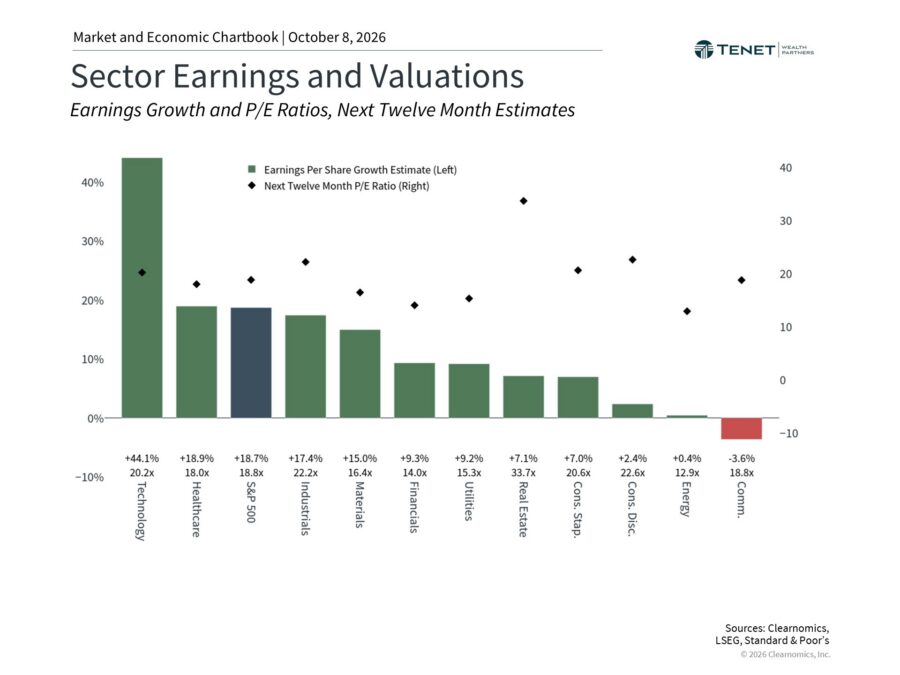
Artificial intelligence continues to influence markets, corporate investment, and earnings expectations.
Technology companies have been among the most visible beneficiaries, raising understandable questions about how much of the market’s performance is concentrated in a relatively small group of companies.
At the same time, AI-related spending extends beyond the largest technology names. Data centers, semiconductors, energy infrastructure, and other industries are part of the buildout as well.
The longer-term question is what all of that investment ultimately means for productivity.
So far, average productivity growth during the 2020s has been 2.1% per year, compared with 1.2% during the 2010s. Whether AI and other technologies can contribute to sustained productivity growth remains an open question.
That’s one reason a longer-term perspective matters. Transformative technologies can take years, or even decades, to work their way through businesses and the broader economy. Market enthusiasm and long-term economic impact don’t always happen on the same timetable.
What Should Investors Be Watching in Q4 2026?
There are plenty of questions heading into the final months of the year. Will Treasury yields remain near multi-decade highs? Will the Fed raise rates again? Will higher oil prices affect inflation more broadly? How will markets respond to the midterm election? And will corporate earnings continue to support current valuations?
We don’t need to know all of those answers today.
What may be more useful is looking at what has changed within your own financial picture. Strong stock market performance may have shifted your portfolio away from its intended allocation. Higher yields may affect how you think about bonds. Today’s borrowing costs may influence a purchase or financing decision.
Those are things you can evaluate.
Markets will continue to respond to interest rates, earnings, politics, technology, and events we can’t anticipate. Your financial plan can provide a framework for making decisions without requiring you to predict every turn along the way.
Q4 2026 Market Outlook: The Bottom Line
The third quarter was a useful reminder that markets don’t always tell one clean story. Stocks can reach new highs while bonds struggle. Interest rates can rise while corporate earnings remain strong. One part of a portfolio can face pressure while another benefits from a very different set of conditions.
As we head into the fourth quarter, staying focused on your goals, time horizon, and overall financial plan can help keep short-term headlines in perspective.
Put Today’s Market in the Context of Your Financial Plan
Interest rates, markets, and economic conditions will continue to change. Tenet can help you consider what those changes mean for your investment strategy and broader financial plan.
No pressure. Just a conversation about your financial plan.

References
- Return figures represent total returns with reinvested dividends. All figures as of September 30, 2026.
- Clearnomics research using Federal Reserve data, as of September 30, 2026.
- Freddie Mac Primary Mortgage Market Survey: https://www.freddiemac.com/pmms
- Clearnomics research using LSEG data, as of September 30, 2026.
- Clearnomics research using FTSE Russell and MSCI data, as of September 30, 2026.
- Clearnomics research using Standard & Poor’s data, as of September 30, 2026.
- U.S. Treasury Fiscal Data, National Debt: https://fiscaldata.treasury.gov/americas-finance-guide/national-debt/
- Clearnomics research using LSEG and Standard & Poor’s data, as of September 30, 2026.
Index Descriptions
S&P 500
The Standard & Poor’s 500 Index is a capitalization-weighted index of 500 stocks designed to measure performance of the broad domestic economy through changes in the aggregate market value of 500 stocks representing all major industries. The modern design of the S&P 500 stock index was first launched in 1957. Performance prior to 1957 incorporates the performance of the predecessor index, the S&P 90.
Dow Jones
The Dow Jones Industrial Average consists of 30 stocks that are major factors in their industries and widely held by individuals and institutional investors.
NASDAQ
The NASDAQ Composite Index measures all NASDAQ domestic and non-U.S. based common stocks listed on The NASDAQ Stock Market. The market value, the last sale price multiplied by total shares outstanding, is calculated throughout the trading day and is related to the total value of the Index.
MSCI Emerging Markets Index
The MSCI EM (Emerging Markets) Index is a free float-adjusted market capitalization weighted index that is designed to measure equity market performance in emerging market countries.
MSCI EAFE Index
The MSCI EAFE Index is a free float-adjusted market capitalization index that is designed to measure equity market performance in developed markets, excluding the U.S. and Canada.
Bloomberg U.S. Aggregate Bond Index
The Bloomberg U.S. Aggregate Bond Index is an index of the U.S. investment-grade fixed-rate bond market, including both government and corporate bonds.
Investment advisory services offered through Tenet Wealth Partners, LLC, a registered investment advisor with the U.S. Securities and Exchange Commission. This material is intended for informational purposes only. It should not be construed as legal or tax advice and is not intended to replace the advice of a qualified attorney or tax advisor. This information is not an offer or a solicitation to buy or sell securities. The information contained may have been compiled from third-party sources and is believed to be reliable.
The information provided in this communication was sourced by Tenet Wealth Partners through public information and public channels and is in no way proprietary to Tenet Wealth Partners, nor is the information provided Tenet Wealth Partner’s position, recommendation or investment advice.
This material is provided for informational/educational purposes only. This material is not intended to constitute legal, tax, investment or financial advice. Investments are subject to risk, including but not limited to market and interest rate fluctuations.
Any performance data represents past performance which is no guarantee of future results. Prices/yields/figures mentioned herein are as of the date noted unless indicated otherwise. All figures subject to market fluctuation and change. Additional information available upon request.
About The Author
Kevan Melchiorre, CFP®Co-Founder & Managing Partner
Kevan Melchiorre co-founded Tenet Wealth Partners in 2021 with a focus on delivering a premier client experience, supported by an innovative and fully integrated approach to wealth planning. As a CERTIFIED FINANCIAL PLANNER® practitioner with over 18 years of wealth management experience, Kevan partners with affluent individuals, families, and institutions to help align their capital […]
Learn more about Kevan