October gave investors a lot to sort through.
After a strong run earlier in the year, stocks turned more volatile. Technology shares came under pressure as investors weighed the rising cost of artificial intelligence (AI). The Federal Reserve held interest rates steady, inflation stayed above the Fed’s target, and the U.S. economy continued to grow at a solid pace.
Some of that may sound contradictory. How can the economy grow while many households still worry about prices? Why would technology stocks fall while corporate earnings are rising?
The short answer is that markets and the economy don’t always move together.
The more useful question isn’t what the market will do next. It’s how these developments fit into your investment strategy and broader financial plan.
A Look Back at October 2026¹
Major U.S. stock indexes finished the month with mixed results. The S&P 500 declined 0.9%, and the technology-heavy Nasdaq Composite fell 5.3%. The Dow Jones Industrial Average moved the other way, gaining 1.7%.
All three indexes remained positive for the year through October 31. The S&P 500 was up 10.7% year-to-date, the Nasdaq 9.4%, and the Dow 7.7%.
International stocks also softened. Developed market stocks, as measured by the MSCI EAFE Index, declined 0.8%. Emerging market stocks, as measured by the MSCI Emerging Markets Index, fell 8.1%.
Bonds helped balance things out. The 10-year Treasury yield ended October at 4.93%, down from 5.29% at the end of September, while the 30-year Treasury yield finished at 5.31%. Because bond prices generally move in the opposite direction of yields, the Bloomberg U.S. Aggregate Bond Index gained 2.4% for the month.
October was a good example of why different investments play different roles in a portfolio. Stocks and bonds don’t always respond to the same news in the same way, and even major stock indexes can produce noticeably different results in the same month.
That’s one reason diversification remains an important part of portfolio construction. It can help manage exposure to any one part of the market, although diversification does not guarantee a profit or protect against loss.
AI Spending Is Supporting Earnings, but the Bigger Questions Remain
Artificial intelligence has been one of the most influential market themes of the past few years.
Much of the attention has gone to the technology companies building AI tools. But the economic impact reaches further. Building the infrastructure behind AI requires major investment in data centers, computer chips, electricity, cooling systems, and construction.
That spending has created opportunities for businesses throughout the supply chain. It has also raised a fair question: how quickly will companies earn a return on what they’re investing?
Some large technology companies are spending heavily on AI infrastructure. That reduces the cash they have left after covering operating costs and capital investments. Investors are understandably asking whether future revenue and productivity gains will justify those costs, and that uncertainty contributed to October’s volatility in technology stocks.
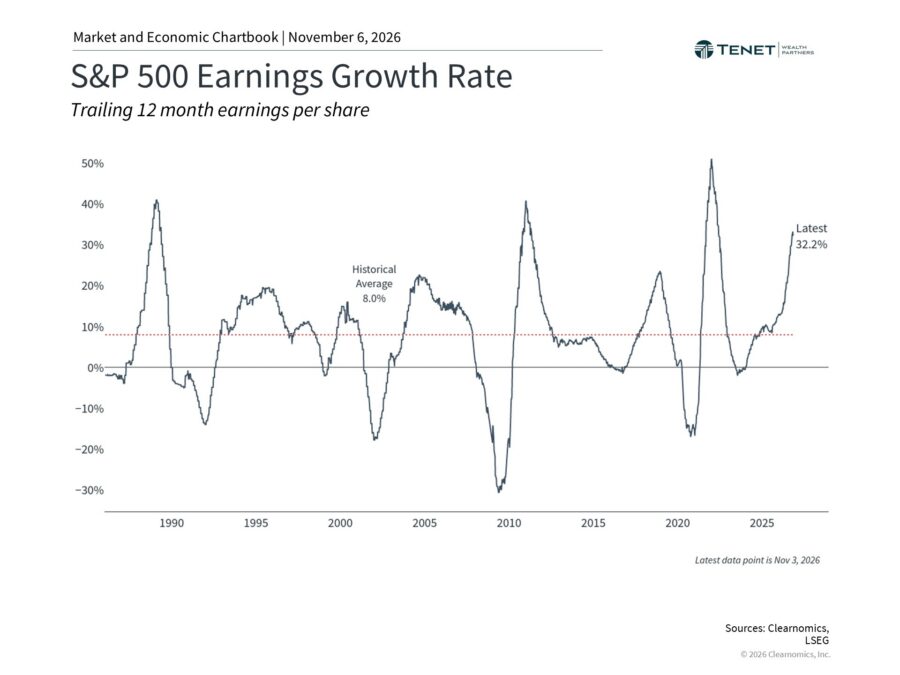
Source: Clearnomics and LSEG. Trailing 12-month earnings per share growth; latest data as of October 27, 2026.²
The chart shows S&P 500 earnings growth of 33.2%, well above the historical average of 8.0%.
Strong earnings can help support stock prices, but they don’t guarantee continued gains. Valuations matter too. The S&P 500’s forward price-to-earnings ratio declined from about 23.3 a year earlier to 18.9 at the end of October.³
Put simply, investors were paying less for each dollar of expected future earnings than they were a year ago.
That doesn’t necessarily mean stocks are inexpensive. It does suggest earnings growth has helped bring stock prices and expected profits into a closer relationship.
What This May Mean for Your Portfolio
AI may influence markets for years to come, but its long-term impact is still uncertain. Companies investing heavily in the technology still need to show those investments can produce lasting financial returns.
That’s one reason to look beyond the most popular sectors or themes. A diversified portfolio can provide exposure to different industries, company sizes, and geographic markets without depending on the success of any one technology.
The goal isn’t to predict which company will benefit most from AI. It’s to keep an investment strategy that reflects your goals, time horizon, and comfort with risk.
Why the Fed Held Rates Steady
Interest rates were another important driver in October.
At its October 28 meeting, the Federal Reserve kept its benchmark federal funds rate in a range of 3.75% to 4.00%.⁴ That followed the Fed’s September increase, its first rate hike in three years.
Policymakers are still balancing solid economic growth against persistent inflation. Energy prices have made that balance harder.
Renewed geopolitical tensions in the Middle East disrupted energy markets and pushed oil prices higher.⁵ Brent crude reached roughly $118 per barrel during October, while West Texas Intermediate (WTI) crude approached $103.¹
Higher energy costs reach well beyond the gas pump. They can raise transportation, manufacturing, and operating costs for businesses, and some of those costs may eventually show up in the prices consumers pay for everyday goods and services.
Inflation data showed that price pressures remained elevated. According to the Bureau of Economic Analysis, the Personal Consumption Expenditures (PCE) price index rose 3.6% over the 12 months ending in September. Core PCE, which excludes food and energy, rose 3.1%.⁶ Both remain above the Fed’s 2% target.
Against that backdrop, the Fed chose to hold rates where they were rather than raise them again. The decision passed 10 to 2. The two dissenting policymakers, Lisa D. Cook and Beth M. Hammack, preferred a quarter-point increase, a sign that inflation remains a real concern inside the Fed.⁴
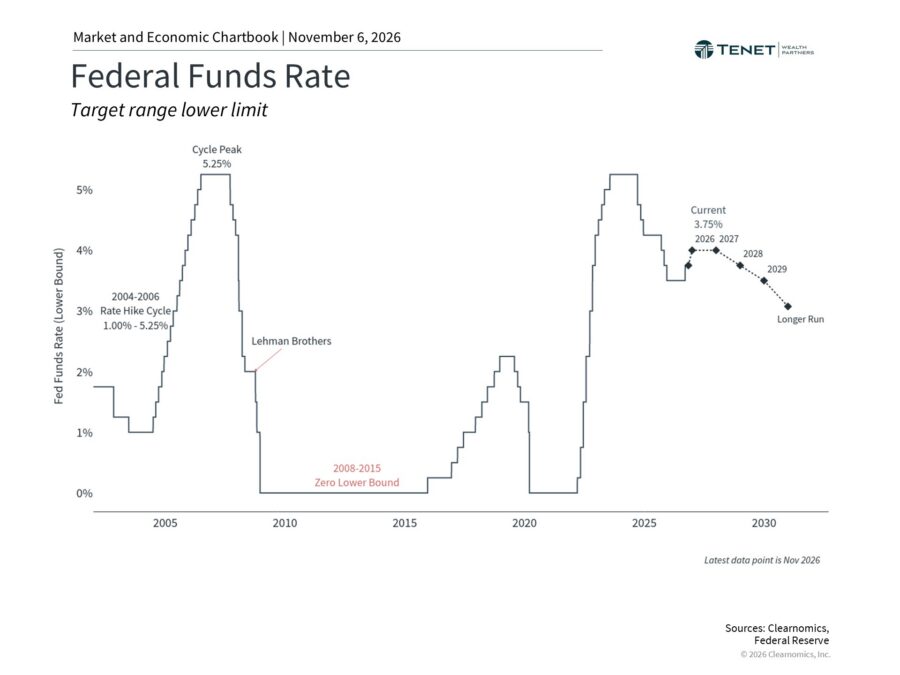
Source: Clearnomics and Federal Reserve. Federal funds rate target range lower limit through October 2026; subsequent projections shown separately.
The chart puts today’s rates in historical perspective. After years of unusually low rates following the 2008 financial crisis and again during the pandemic, policy has shifted toward a higher-rate environment.
Further increases remain possible if inflation stays elevated. Still, interest-rate projections are not a promise or a schedule. The Fed’s decisions will continue to depend on inflation, employment, and other incoming data.
What Higher Rates Could Mean for Your Financial Plan
Interest rates touch several parts of your financial life.
- For borrowers, higher rates can increase the cost of mortgages, business loans, and other financing.
- For savers, higher yields may create opportunities to earn more income from certain cash and fixed-income investments.
- For bond investors, prices generally move opposite to rates, so changes in yields can affect the value of existing holdings.
Rather than trying to anticipate every Fed decision, it can be more useful to look at how different rate environments affect your own situation.
Someone approaching retirement may want to review the income their portfolio is expected to provide. A family planning a home purchase may want to revisit borrowing costs and monthly cash flow.
Those decisions are usually more meaningful than predicting the timing of the Fed’s next move.
The Economy Keeps Growing, Even as Many Households Feel the Strain
While markets were volatile, the broader U.S. economy continued to expand.
According to the Bureau of Economic Analysis, real gross domestic product (GDP) grew at an annualized rate of 3.4% in the third quarter of 2026.⁷ GDP measures the value of goods and services produced across the economy, which makes it one way to gauge overall economic activity.
Consumer spending rose 2.5% and business investment rose 3.3%. Business investment was supported in part by continued spending on AI infrastructure, including data centers and related equipment. The BEA noted that growth in equipment investment was led by information processing equipment, mainly computers.⁷
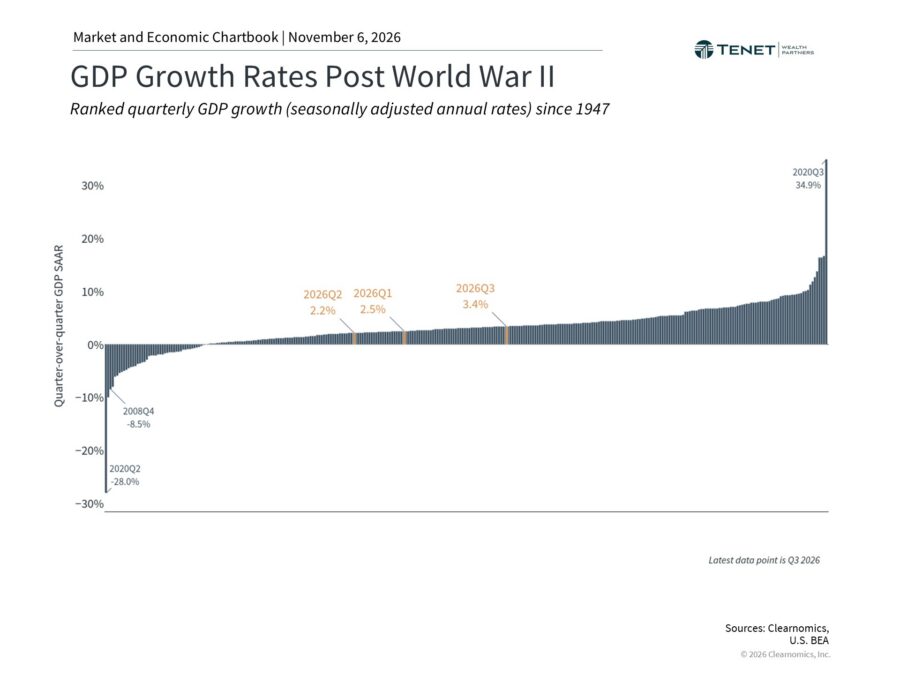
Source: Clearnomics and U.S. Bureau of Economic Analysis. Ranked quarterly real GDP growth rates, seasonally adjusted at annual rates, 1947 through Q3 2026.
The chart places the latest reading in historical context. At 3.4%, third-quarter growth was stronger than the 2.5% and 2.2% annualized rates in the first and second quarters of this year.
Quarterly GDP figures can move around, and this advance estimate will be revised. Even so, the latest reading suggests the economy kept its momentum despite higher interest rates and inflation concerns.
Why the Economy Can Feel Different at Home
One of the more interesting themes this year has been the gap between economic growth and how many people feel about the economy.
The data shows households are still spending and businesses are still investing. According to the Fed, the unemployment rate has changed little.⁴ Yet many consumers remain worried about inflation, the job market, and their own financial outlook.
Both can be true at the same time.
An economy can keep growing while individual households feel pressure from higher living costs. For a family managing a monthly budget, the cost of groceries, utilities, insurance, and housing often matters more than a strong GDP report. At the same time, rising investment values, employment income, and household savings can help support spending.
That’s why broad economic statistics don’t always tell the full story of how people experience the economy.
For investors, the distinction is worth keeping in mind. Economic growth can support corporate earnings over time, but it doesn’t rule out market volatility or financial challenges for individual households.
What Should Investors Watch as 2026 Comes to a Close?
October raised several questions that may keep shaping the investment environment. Will AI spending translate into lasting productivity gains and stronger profits? Will inflation ease enough for the Fed to reconsider its stance? Can consumer spending keep supporting growth if everyday costs stay high?
We don’t need to know all of those answers today.
What may be more useful is looking at what has changed within your own financial picture. Strong stock performance earlier in the year may have shifted the balance between stocks and bonds in your portfolio. Higher rates may affect your income expectations or a borrowing decision. Changes in your personal circumstances may be a reason to revisit your goals.
Those are things you can evaluate.
A financial plan gives you a framework for making these decisions as conditions change. That doesn’t mean ignoring the headlines. It means considering them in the context of your overall financial picture, rather than reacting to each one.
October 2026 Market Update: The Bottom Line
October was a reminder that markets and the economy rarely follow one clean story. Technology stocks struggled even as earnings grew. The Fed held rates steady while inflation stayed elevated. And the economy kept expanding even as many households felt the pinch of higher costs.
For long-term investors, the focus doesn’t have to be on predicting every market move. It can be on keeping your investment strategy aligned with your goals, managing risk appropriately, and making thoughtful adjustments when your circumstances change.
At Tenet Wealth Partners, we believe investment decisions are most meaningful when they’re connected to the rest of your financial life. Whether you’re approaching retirement, reviewing your investment allocation, or weighing a major financial decision, understanding how today’s environment fits into your broader plan can help you move forward with more clarity.
References
- Clearnomics, Monthly Market Update for October 2026, published November 2, 2026. Return figures represent total returns with reinvested dividends. Market data, Treasury yields, and oil prices as of October 30–31, 2026, unless otherwise noted. September 30, 2026 Treasury yield from Tenet Wealth Partners, Q4 2026 Market Outlook. https://mailchi.mp/clearnomics/market-update-5150449
- Clearnomics research using LSEG data, as of October 27, 2026.
- Clearnomics research using S&P 500 data, as of October 30, 2026.
- Board of Governors of the Federal Reserve System, Federal Open Market Committee Statement and Implementation Note, October 28, 2026: https://www.federalreserve.gov/monetarypolicy/files/monetary20261028a1.pdf
- International Maritime Organization, Middle East – Highlighted Incidents: https://www.imo.org/en/mediacentre/hottopics/pages/middle-east-highlighted-incidents.aspx
- U.S. Bureau of Economic Analysis, Personal Income and Outlays, September 2026, released October 29, 2026: https://www.bea.gov/news/2026/personal-income-and-outlays-september-2026
- U.S. Bureau of Economic Analysis, Gross Domestic Product (Advance Estimate), 3rd Quarter 2026, released October 29, 2026: https://www.bea.gov/news/2026/gdp-advance-estimate-3rd-quarter-2026
Chart Sources
- Chart 1: Clearnomics and LSEG, S&P 500 Earnings Growth Rate, November 2, 2026.
- Chart 2: Clearnomics and Federal Reserve, Federal Funds Rate, November 2, 2026.
- Chart 3: Clearnomics and U.S. Bureau of Economic Analysis, GDP Growth Rates Post World War II, November 2, 2026.
Index Descriptions
S&P 500
The Standard & Poor’s 500 Index is a capitalization-weighted index of 500 stocks designed to measure performance of the broad domestic economy through changes in the aggregate market value of 500 stocks representing all major industries. The modern design of the S&P 500 stock index was first launched in 1957. Performance prior to 1957 incorporates the performance of the predecessor index, the S&P 90.
Dow Jones
The Dow Jones Industrial Average consists of 30 stocks that are major factors in their industries and widely held by individuals and institutional investors.
NASDAQ
The NASDAQ Composite Index measures all NASDAQ domestic and non-U.S. based common stocks listed on The NASDAQ Stock Market. The market value, the last sale price multiplied by total shares outstanding, is calculated throughout the trading day and is related to the total value of the Index.
MSCI Emerging Markets Index
The MSCI EM (Emerging Markets) Index is a free float-adjusted market capitalization weighted index that is designed to measure equity market performance in emerging market countries.
MSCI EAFE Index
The MSCI EAFE Index is a free float-adjusted market capitalization index that is designed to measure equity market performance in developed markets, excluding the U.S. and Canada.
Bloomberg U.S. Aggregate Bond Index
The Bloomberg U.S. Aggregate Bond Index is an index of the U.S. investment-grade fixed-rate bond market, including both government and corporate bonds.
Indices are unmanaged, and you cannot invest directly in an index.
Put Today’s Market in the Context of Your Financial Plan
Markets, interest rates, and economic conditions will continue to change. Tenet can help you consider what those changes mean for your investment strategy and longer-term goals, without needing to predict what happens next.
Review Your Financial Planning
No pressure. Just a conversation about your financial plan.

Investment advisory services offered through Tenet Wealth Partners, LLC, a registered investment advisor with the U.S. Securities and Exchange Commission. This material is intended for informational purposes only. It should not be construed as legal or tax advice and is not intended to replace the advice of a qualified attorney or tax advisor. This information is not an offer or a solicitation to buy or sell securities. The information contained may have been compiled from third-party sources and is believed to be reliable.
The information provided in this communication was sourced by Tenet Wealth Partners through public information and public channels and is in no way proprietary to Tenet Wealth Partners, nor is the information provided Tenet Wealth Partner’s position, recommendation or investment advice.
This material is provided for informational/educational purposes only. This material is not intended to constitute legal, tax, investment or financial advice. Investments are subject to risk, including but not limited to market and interest rate fluctuations.
Any performance data represents past performance which is no guarantee of future results. Prices/yields/figures mentioned herein are as of the date noted unless indicated otherwise. All figures subject to market fluctuation and change. Additional information available upon request.
About The Author
Kevan Melchiorre, CFP®Co-Founder & Managing Partner
Kevan Melchiorre co-founded Tenet Wealth Partners in 2021 with a focus on delivering a premier client experience, supported by an innovative and fully integrated approach to wealth planning. As a CERTIFIED FINANCIAL PLANNER® practitioner with over 18 years of wealth management experience, Kevan partners with affluent individuals, families, and institutions to help align their capital […]
Learn more about Kevan